Showing posts with label map. Show all posts

Wednesday, December 17, 2014

MARS HiRise Map: Signs of Ancient Mars Lakes and Quakes

Long ago, in the largest canyon system in our solar system, vibrations from "marsquakes" shook soft sediments that had accumulated in Martian lakes.

The shaken sediments formed features that now appear as a series of low hills apparent in a geological map based on NASA images.

The map was released by the U.S. Geological Survey (USGS).

This map of the western Candor Chasma canyon within Mars' Valles Marineris is the highest-resolution Martian geological map ever relased by USGS.

It is derived from images taken by the High Resolution Imaging Science Experiment (HiRISE) camera on NASA's Mars Reconnaissance Orbiter (MRO), which reveal details smaller than a desk.

"This new map shows that at the time these sediments were deposited, a part of west Candor Chasma, specifically Condor Colles, contained numerous shallow, spring-fed lakes," said map author Chris Okubo of the USGS Astrogeology Science Center, Flagstaff, Arizona.


"These lakes helped to trap wind-blown sand and dust, which accumulated over time and formed the extensive sedimentary deposits we see today."

The wet sediments experienced seismic shaking in "marsquakes" related to movement along several large geological faults in the area. A series of low hills resulted.

Valles Marineris is more than 2,500 miles (4,000 kilometers) long. The conditions under which sedimentary deposits in it formed have been an open issue for decades.

Possibilities proposed have included accumulation in lakebeds, volcanic eruptions under glaciers within the canyons, and acculation of wind-blown sand and dust.

The map is available for download here. Additional information about the map is available here.

Thursday, November 20, 2014

NASA Lidar Lasers to Map Earth's Forests in 3D

An artist's conception of the 3D maps of forest architecture that data from GEDI could produce.

Credit: NASA's Goddard Space Flight Center

A new laser instrument developed for the International Space Station is expected to generate incredible 3D maps of Earth's forests.

The instrument called Global Ecosystem Dynamics Investigation (GEDI) uses lidar, a special kind of laser technology, to create detailed 3D maps and measure the biomass of forests.

NASA has already launched a satellite designed to measure carbon dioxide in the atmosphere, but the new instrument, once launched, will allow scientists to estimate the total amount of carbon stored here on Earth inside trees.

"(GEDI) lidar will have a tremendous impact on our ability to monitor forest degradation, adding to the critical data needed to mitigate the effects of climate change," Patrick O'Shea, chief research officer at the University of Maryland, said in a statement.

Scientists already knew that trees absorb carbon. What scientists don't know is how much they store.

This is a problem because scientists can't predict how much extra carbon would escape into the atmosphere if a forest was destroyed or if planting new trees would be enough to offset the emissions.

"One of the most poorly quantified components of the carbon cycle is the net balance between forest disturbance and regrowth," Ralph Dubayah, the (GEDI) principal investigator at the University of Maryland, said in the same statement.

GEDI's lidar instrument works by shooting streams of light particles at the Earth that then reflect back and are picked up by a detector.

The time it takes the particles to reach Earth and bounce back is converted into a distance.

Every material that the light particles pass through on their journey leaves behind a "fingerprint" that the detector can read.

That means that light particles that pass through leafy tree canopies will look different than the particles that pass through branches or trunks. The unique markers will allow scientists to construct detailed 3D maps of forest architecture.

The lidar pulses will measure the height of trees to about a 3-foot (1 meter) accuracy and allow scientists to estimate the total biomass in a forest and how much carbon it's storing.

GEDI will have three lasers that will shoot out a total of 14 laser beams that will cover about 4 miles (6.5 kilometers). The team of engineers behind GEDI estimate that it will send out about 16 billion laser pulses every year.

Piers Sellers, deputy director of Goddard's Sciences and Exploration Directorate, said GEDI's data will be invaluable when it's combined with historic records of carbon levels collected by satellites like Landsat and MODIS which have been hovering over Earth for decades.

Scientists will also combine the 3D maps with images, maps and data collected from other satellites.

The ultimate goal is to create a database that will monitor changes in forests over time.

Scientists hope the combined data will reveal more about land use, biodiversity and climate change effects.

NASA officials estimate that engineers will complete GEDI by 2018. Once aboard the space station, it will scan most tropical and temperate forests between 50 degrees north and 50 degrees south latitude.

Monday, September 29, 2014

ESO VLT: Hosting unique intergalactic GPS instrument to map the stars

Artist's impression of the MOONS instrument. Credit: STFC

A €9M contract is announced today for Scottish engineers and designers to build a unique and powerful instrument that aims to tackle some of the most compelling astronomical puzzles, such as how stars and galaxies form and evolve, and probing the structure of our own Milky Way.

A project team from the Astronomy Technology Centre (ATC) in Edinburgh will lead this international project to develop and build MOONS for the European Southern Observatory's (ESO) Very Large Telescope (VLT) in northern Chile, already the world's most productive ground-based astronomical facility.

MOONS (Multi-Object Optical and Near-infrared Spectrograph) will allow astronomers to see obscured areas in the Milky Way at a distance of around 40,000 light years away, and enable them to create a 3D map of our galaxy.

This is difficult to do as the Earth is in the middle of the Milky Way's disc, so the process is like trying to map a forest of densely-packed trees from the inside.

Director of the ATC, Professor Gillian Wright, said "The team at ATC in Scotland have an opportunity with this project to enable all of us to understand why the Milky Way looks the way it does."

"This instrument will act as an intergalactic GPS to help us to navigate through the billions of stars in our galaxy and create a comprehensive map of its structure."

Conceived at the ATC, part of the Science and Technology Facilities Council (STFC)MOONS is scheduled to become operational by 2019.

Building such an ambitious and powerful new device, which will be about the size of a transit van, will take around 200 staff-years of effort, with the hardware alone costing €9M.

The full project will cost around €23M. The ATC will lead the Project Office managing the multinational consortium that will construct MOONS, and will also play a vital design role for key components and ensure the project's benefits extend throughout UK industry.

ESO's VLT platform. (Credit: ESO)

Like any spectrograph, MOONS will use the colour of light emitted by objects to reveal their chemical composition, mass, speed and other properties.

Breaking new ground by simultaneously observing 1000 objects using fibre-optic cables to feed their visible and infrared light into the instrument, it will survey large samples of objects far faster than any existing instrument and conduct surveys that would be virtually impossible using today's technologies.

Not surprisingly, the design will pose extraordinary technical demands. For example, each of the 1000-plus fibres will have to move into position very quickly, with great accuracy and without colliding with each other.

The ATC will develop the most innovative component, the individual motorised systems allowing each fibre to move rapidly into position; it will also develop the cryostat system (used to cool MOONS down to -170°C) vital to enabling the infrared observations needed to penetrate galactic and intergalactic dust clouds.

The University of Cambridge will take the credit for developing complex cameras capable of meeting the instrument's demanding performance requirements.

Partnerships with a range of UK equipment suppliers will also contribute across the project, helping the UK to further strengthen its cutting-edge scientific capabilities in the relevant fields.

Tuesday, August 12, 2014

NASA's 3-D Study of Comets Reveals Chemical Factory at Work


This rotating 3-D map shows how HNC molecules (made of hydrogen, carbon and nitrogen) are released from the nucleus of comet Lemmon and then spread evenly throughout the atmosphere, or coma. 

Similar maps revealed that HNC and formaldehyde are produced in the coma, rather than the comet's nucleus. 

Image courtesy Brian Kent /NRAO /AUI /NSF.

A NASA-led team of scientists has created detailed 3-D maps of the atmospheres surrounding comets, identifying several gases and mapping their spread at the highest resolution ever achieved.

"We achieved truly first-of-a-kind mapping of important molecules that help us understand the nature of comets," said Martin Cordiner, a researcher working in the Goddard Center for Astrobiology at NASA's Goddard Space Flight Center in Greenbelt, Maryland. Cordiner led the international team of researchers.

Almost unheard of for comet studies, the 3-D perspective provides deeper insight into which materials are shed from the nucleus of the comet and which are produced within the atmosphere, or coma.

This helped the team nail down the sources of two key organic, or carbon-containing, molecules.

The observations were conducted in 2013 on comets Lemmon and ISON using the Atacama Large Millimeter/submillimeter Array (ALMA), a network of high-precision antennas in Chile. These comets are the first to be studied with ALMA.

The ALMA observations combine a high-resolution 2-D image of a comet's gases with a detailed spectrum at each point.

From these spectra, researchers can identify the molecules present at every point and determine their velocities (speed plus direction) along the line-of-sight; this information provides the third dimension - the depth of the coma.

"So, not only does ALMA let us identify individual molecular species in the coma, it also gives us the ability to map their locations with great sensitivity," said Anthony Remijan, a scientist with the National Radio Astronomy Observatory, one of the organizations that operates ALMA, and a co-author of the study.

The researchers reported results for three molecular species, focusing primarily on two whose sources have been difficult to discern (except in comet Halley).

The 3-D maps indicated whether each molecule was flowing outward evenly in all directions or coming off in jets or in clumps.

In each comet, the team found that two species - formaldehyde and HNC (made of one hydrogen, one nitrogen and one carbon) - were produced in the coma.

For formaldehyde, this confirmed what researchers already suspected, but the new maps contained enough detail to resolve clumps of the material moving into different regions of the coma day-by-day and even hour-by-hour.

For HNC, the maps settled a long-standing question about the material's source. Initially, HNC was thought to be pristine interstellar material coming from the nucleus of a comet, whereas later work suggested other possible sources.

The new study provided the first proof that HNC is produced during the breakdown of large molecules or organic dust in the coma.

"Understanding organic dust is important, because such materials are more resistant to destruction during atmospheric entry, and some could have been delivered intact to early Earth, thereby fueling the emergence of life," said Michael Mumma, Director of the Goddard Center for Astrobiology, and a co-author on the study.

"These observations open a new window on this poorly known component of cometary organics."

Tuesday, March 11, 2014

Council of Giants: Astronomers map out Earth's place in the universe

This is a diagram showing the brightest galaxies within 20 million light years of the Milky Way, as seen from above. 

The largest galaxies, here shown in yellow at different points around the dotted line, make up the "Council of Giants." 

Credit: Marshall McCall / York University

We live in a galaxy known as the Milky Way – a vast conglomeration of 300 billion stars, planets whizzing around them, and clouds of gas and dust floating in between.

Though it has long been known that the Milky Way and its orbiting companion Andromeda are the dominant members of a small group of galaxies, the Local Group, which is about 3 million light years across, much less was known about our immediate neighbourhood in the universe.

Marshall McCall
Now, a new paper by York University Physics & Astronomy Professor Marshall McCall, published today in the Monthly Notices of the Royal Astronomical Society, maps out bright galaxies within 35-million light years of the Earth, offering up an expanded picture of what lies beyond our doorstep.

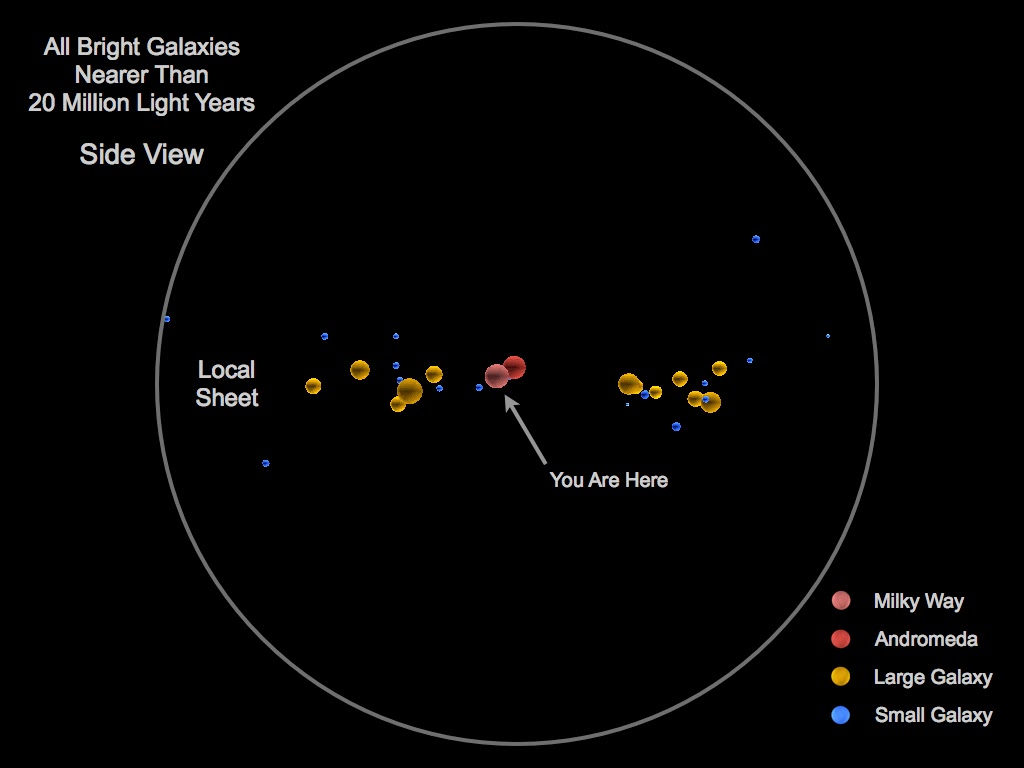
"All bright galaxies within 20 million light years, including us, are organized in a 'Local Sheet' 34-million light years across and only 1.5-million light years thick," says McCall.

"The Milky Way and Andromeda are encircled by twelve large galaxies arranged in a ring about 24-million light years across – this 'Council of Giants' stands in gravitational judgment of the Local Group by restricting its range of influence."

This is a diagram showing the brightest galaxies within 20 million light years of the Milky Way, this time viewed from the side. 

Credit: Marshall McCall / York University

McCall says twelve of the fourteen giants in the Local Sheet, including the Milky Way and Andromeda, are "spiral galaxies" which have highly flattened disks in which stars are forming.

The remaining two are more puffy "elliptical galaxies", whose stellar bulks were laid down long ago.

This movie illustrates the positions of the nearby galaxies, including those in the ‘Council of Giants’, in three dimensions. Credit: Marshall McCall / York University

Intriguingly, the two ellipticals sit on opposite sides of the Council. Winds expelled in the earliest phases of their development might have shepherded gas towards the Local Group, thereby helping to build the disks of the Milky Way and Andromeda.

McCall also examined how galaxies in the Council are spinning. He comments: "Thinking of a galaxy as a screw in a piece of wood, the direction of spin can be described as the direction the screw would move (in or out) if it were turned the same way as the galaxy rotates."

"Unexpectedly, the spin directions of Council giants are arranged around a small circle on the sky. This unusual alignment might have been set up by gravitational torques imposed by the Milky Way and Andromeda when the universe was smaller."

More Information: A Council of Giants - M.McCall, mnras.stu199

Tuesday, September 3, 2013

Dark Energy Survey (DES): Five-year mission to map southern sky in detail

This image of the NGC 1398 galaxy was taken with the Dark Energy Camera (DECam)

This galaxy lives in the Fornax cluster, roughly 65 million light years from Earth. 

It is 135,000 light years in diameter, just slightly larger than our own Milky Way galaxy, and contains more than a hundred million stars. 

Credit: Dark Energy Survey.

Tonight, as the sun sinks below the horizon, the world's most powerful digital camera will once again turn its gleaming eye skyward.

Tonight, and for hundreds of nights over the next five years, a team of physicists and astronomers from around the globe will use this remarkable machine to try to answer some of the most fundamental questions about our universe.

Dark Energy Survey - DECam: Fermilab  
On Aug. 31, the Dark Energy Survey (DES) officially began. Scientists on the survey team will systematically map one-eighth of the sky (5000 square degrees) in unprecedented detail.

The start of the survey is the culmination of 10 years of planning, building and testing by scientists from 25 institutions in six countries.

The survey's goal is to find out why the expansion of the universe is speeding up, instead of slowing down due to gravity, and to probe the mystery of dark energy, the force believed to be causing that acceleration.

James Siegrist
"The Dark Energy Survey will explore some of the most important questions about our existence," said James Siegrist, associate director for High Energy Physics at the U.S. Department of Energy's Office of Science.

"In five years' time, we will be far closer to the answers, and far richer in our knowledge of the universe."

"With the start of the survey, the work of more than 200 collaborators is coming to fruition," said DES Director Josh Frieman of the U.S. Department of Energy's Fermi National Accelerator Laboratory.

"It's an exciting time in cosmology, when we can use observations of the distant universe to tell us about the fundamental nature of matter, energy, space and time."


Composite Dark Energy Camera image of one of the sky regions that the collaboration will use to study supernovae, exploding stars that will help uncover the nature of dark energy. 

The outlines of each of the 62 Charged Coupled Devices can be seen. 

This picture spans 2 degrees across on the sky and contains 520 megapixels.

The survey will use four methods to probe dark energy:


  • Counting galaxy clusters. While gravity pulls mass together to form galaxies, dark energy pulls it apart. The Dark Energy Camera will see light from 100,000 galaxy clusters billions of light-years away. Counting the number of galaxy clusters at different points in time sheds light on this cosmic competition between gravity and dark energy.
  • Measuring supernovae. A supernova is a star that explodes and becomes as bright as an entire galaxy of billions of stars. By measuring how bright they appear on Earth, we can tell how far away they are. Scientists can use this information to determine how fast the universe has been expanding since the star's explosion. The survey will discover 4000 of these supernovae, which exploded billions of years ago in galaxies billions of light-years away. 
  • Studying the bending of light. When light from distant galaxies encounters dark matter in space, it bends around the matter, causing those galaxies to appear distorted in telescope images. The survey will measure the shapes of 200 million galaxies, revealing the cosmic tug of war between gravity and dark energy in shaping the lumps of dark matter throughout space.
  • Using sound waves to create a large-scale map of expansion over time. When the universe was less than 400,000 years old, the interplay between matter and light set off a series of sound waves traveling at nearly two-thirds the speed of light. Those waves left an imprint on how galaxies are distributed throughout the universe. The survey will measure the positions in space of 300 million galaxies to find this imprint and use it to infer the history of cosmic expansion.


Friday, March 15, 2013

Dutch Elm Disease: Scientists map genome of fungus

Researchers from the University of Toronto and SickKids Research Institute announced today that they have successfully mapped the genes in the fungus that causes Dutch elm disease.

The researchers believe this is the first time the 30 million DNA letters for the fungus Ophiostoma ulmi have been mapped.

The findings, published in this week's online journal BMC Genomics, could help scientists figure out how to prevent the fungus from destroying elm trees in the future.

"Essentially, Dutch elm disease is caused by a fungus that prevents the normal distribution of nutrients in the tree by blocking the flow of sap," said Alan Moses, an Assistant Professor with the University of Toronto's department of Cell & Systems Biology, one of the authors of the study. "The tree wilts and eventually dies."

"Relatively little is known about the fungus that causes Dutch elm disease, and it's a very distant relative of the fungi that are more often studied by researchers, like bread mould or beer yeast. "

"We hope that the availability of the genome will encourage and speed-up research on this fungus -- it's only a matter of time before most the elm trees are gone."

Dutch elm disease is believed to have originated in the Himalayas, travelling to Europe from the Dutch East Indies in the late 1800s.

It emerged in Holland shortly after the First World War, earning the name Dutch elm disease.

It is the most destructive elm tree disease in North America, and typically kills most trees within two years of infection.

Dutch elm disease is a problem in many parts of the world, particularly Scotland, Spain, Italy, Western Canada and New Zealand.

The above story is reprinted from materials provided by University of Toronto

Wednesday, March 6, 2013

NASA Messenger Spacecraft: Completes Map of Planet Mercury

Scientists use images from NASA's Messenger spacecraft to create these global views of Mercury, the most complete maps ever. The images were released on Feb. 22, 2013.

CREDIT: NASA/Johns Hopkins University Applied Physics Laboratory/Carnegie Institution of Washington

The surface of the planet Mercury has been completely mapped for the first time in history, scientists say.

The closest planet to the sun hasn't received as much scientific attention as some of its more flashy solar system neighbours, such as Mars, but NASA's Messenger spacecraft is helping to close the gap.

Papers published in Science Express provide support for the long-held hypothesis that Mercury's permanently shadowed polar craters contain water ice. 

The probe has been in orbit around Mercury since March 2011, and its team announced Feb. 28 that the spacecraft had finished mapping the planet's surface.

"We can now say we have imaged every square meter of Mercury's surface from orbit," said Messenger principal investigator Sean Solomon of the Johns Hopkins University Applied Physics Laboratory in Laurel, Md. "Admittedly, some regions are in permanent shadow, but we're actually peering into those shadows with our imaging systems."


Before Messenger, less than half the surface had been imaged by NASA's Mariner 10 spacecraft, which made several flybys of Mercury in 1974 and 1975.

Messenger is the first probe to orbit the planet. In addition to photographing the unseen parts of Mercury, the spacecraft substantially improved on the resolution of existing maps.

"When we set out with the Messenger mission we didn't know if the planet would look like the other half that was seen in the '70s," Solomon reported.

"There was a great debate over how important volcanism was in the history of Mercury."

Messenger quickly showed that not only did volcanism occur during Mercury's past, but it might have been widespread.

The spacecraft also revealed never-before-seen types of terrain on the planet, such as surface pockmarks called hollows that scientists suspect are created when volatile materials sublimate off the surface.

"Unstable material is exposed to the temperatures and space environment, and slowly over thousands, maybe millions, of years, it's lost to Mercury's atmosphere and to space, to create a depression or hollow in an area where there are often many such hollows that etch the terrain," Solomon said.

Saturday, June 23, 2012

Heat Map of the Northern United States

Credit: University of Wisconsin Madison, Space Science and Engineering Center.

The blast of scorching summer heat hitting the eastern half and southwest regions of the United States has broken a rash of temperature records across the regions.

Yesterday (June 21), on the first full day of summer, high temperatures in states from Maine to New York to Arizona shattered previous record highs for the day, in a catalog that stretches back more than 100 years in some places.

Across the nation, the scalding heat broke a total of 47 record highs and tied 30 of them.

Monday, June 18, 2012

NASA Maps Global View of Health-Sapping Air Pollution

In many developing countries, the absence of surface-based air pollution sensors makes it difficult, and in some cases impossible, to get even a rough estimate of the abundance of a subcategory of airborne particles that epidemiologists suspect contributes to millions of premature deaths each year.

The problematic particles, called fine particulate matter (PM2.5), are 2.5 micrometers or less in diameter, about a tenth the fraction of human hair. These small particles can get past the body’s normal defenses and penetrate deep into the lungs.

To fill in these gaps in surface-based PM2.5 measurements, experts look toward satellites to provide a global perspective.

Yet, satellite instruments have generally struggled to achieve accurate measurements of the particles in near-surface air.

The problem: Most satellite instruments can't distinguish particles close to the ground from those high in the atmosphere.

In addition, clouds tend to obscure the view and bright land surfaces, such as snow, desert sand, and those found in certain urban areas can mar measurements.

However, the view got a bit clearer this summer with the publication of the first long-term global map of PM2.5 in a recent issue of Environmental Health Perspectives.

Canadian researchers Aaron van Donkelaar and Randall Martin at Dalhousie University, Halifax, Nova Scotia, Canada, created the map by blending total-column aerosol amount measurements from two NASA satellite instruments with information about the vertical distribution of aerosols from a computer model.

Read more of this article here: NASA - Global View of Health-Sapping Air Pollution

Wednesday, June 6, 2012

NASA - 2012 Transit of Venus - Global Map

For Northern Hemisphere locations above latitude ~67° north, all of the transit is visible regardless of the longitude. Northern Canada and all of Alaska will also see the entire event.

Residents of Iceland are in a unique wedge-shaped part of the path (Region X in Figure 1).

They will see both the start and end of the transit but the Sun will set for a short period around greatest transit. A similarly shaped region exists south of Australia (Region Y in Figure 1), but here, the Sun rises after the transit begins and sets before the event ends.

NASA - 2012 Transit of Venus

Thursday, March 22, 2012

NASA Messenger: Mercury mosaic image

The planet Mercury is pictured in this mosaic photograph compiled with images taken from the spacecraft Messenger. 

After its first Mercury solar day (176 Earth days) in orbit, Messenger has nearly completed two of its main global imaging campaigns: a monochrome map at 250m/pixel and an eight-colour, 1-km/pixel map.

Apart from small gaps, which will be filled in during the next solar day, these global maps now provide uniform lighting conditions ideal for assessing the form of Mercury's surface features as well as the colour and compositional variations across the planet.

Picture: REUTERS/NASA/Johns Hopkins University Applied Physics Laboratory/Carnegie Institution of Washington

Friday, January 13, 2012

New map of the universe reveals its history for the past six-billion years

This image shows the positions of the 900,000 luminous galaxies used in four Sloan Digital Sky Survey studies described during the 2012 annual meeting of the American Astronomical Society. 

Each green dot represents one galaxy. 

The image covers a redshift range from 0.25 to 0.75, a time when the universe was between 7-billion and 11-billion years old. 

Credit: David Kirkby (University of California, Irvine) and the SDSS-III Collaboration

Friday, November 18, 2011

NASA Lunar Recon (LRO): Sharpest Ever Moon Map

NASA's Lunar Reconnaissance Orbiter (LRO) science team has released the highest resolution near-global topographic map of the Moon ever created.

Though the Moon is the Earth's closest neighbour, yet knowledge of its morphology is still limited.

"Due to the limitations of previous missions, a global map of the Moon's topography at high resolution has not existed until now," said NASA while releasing the map.

LRO's Wide Angle Camera and the Lunar Orbiter Laser Altimeter instrument will help scientists portray the shape of the entire Moon at high resolution accurately.

Check out below the new topographic map that shows the Moon's surface shape and features with a pixel scale close to 328 feet.

Thursday, November 17, 2011

Volcanic Destruction: 11 Geological Maps of Volcanoes

It's not always obvious what it is that scientists find beautiful about a graph, microscope slide, soil sample or some other aspect of their work.

It just looks like numbers, blobs or dirt to the rest of us but sometimes a scientific result or product is so visually appealing, anyone would want to hang it on their wall as art.

Geological maps are often in this category. And some of the most beautiful geological maps are of volcanoes.

The colours on geological maps represent different rock units of different ages.

With an active lifespan of thousands, or even hundreds of thousands of years, volcanoes produce many layers of ash and flows of lava that will end up as different colours on the map and with the circular shape of many volcanoes and the radiating rock units, the maps can really be striking.

Wired has collected some excellent examples of geological maps of volcanoes from the United States and Japan. You don't have to be a geologist or even a scientist to have trouble picking a favourite.

Check them all out on their website here

Thursday, February 18, 2010

Researchers Chart Genomic Map Spanning Over 2 Dozen Cancers

An international team of researchers has created a genome-scale map of 26 different cancers, revealing more than 100 genomic sites where DNA from tumors is either missing or abnormally duplicated compared to normal tissues.

The study, the largest of its kind, finds that most of these genetic abnormalities are not unique to one form of cancer, but are shared across multiple cancers. The work appears in the February 18 issue of the journal Nature.

"Our findings show that many genome alterations are universal across different cancers. Although this has been known for some types of changes, the degree to which so many alterations are shared was pretty surprising to us," said senior author Matthew Meyerson, a professor of pathology at the Dana-Farber Cancer Institute and senior associate member of the Broad Institute of Harvard and MIT.

"It suggests that, in the future, a driving force behind cancer treatment will be common genomic alterations, rather than tumors' tissue of origin."

Today, cancers are characterized largely by their symptoms: the organ in the body in which they first arise and the appearance of tumour cells under a microscope.

Although this information is valuable, it fails to highlight cancers' molecular underpinnings, which could be used in the laboratory to discover new, more effective cancer therapies and in the clinic to improve diagnosis and treatment.

A goal of modern biomedical research is to fill this knowledge gap and describe all cancers based on what drives them - that is, the genetic aberrations that initiate and maintain tumor growth.

Wednesday, February 3, 2010

Volcanic Hazard Map Produced For Island Of Gran Canaria


Volcanic Hazard Map Produced For Island Of Gran Canaria

Spanish and French researchers have defined the age, location, size and geochemistry of the volcanoes of Gran Canaria during the Holocene, 11,000 years ago, in order to draw up a map of volcanic hazards for the island.
The research shows that the area of greatest volcanic activity is one of the most heavily populated areas in the north east of the island, which has suffered 24 eruptions over the period studied.
The team of French and Spanish scientists led by researchers from the University of Las Palmas de Gran Canaria (ULPGC) and the "Jaume Almera" Institute of Earth Sciences (CSIC, Barcelona) combined the data from previous studies with the results of analysis of 13 new radiocarbon ages in order to gain an understanding of the history of the island and predict the areas to be struck by future volcanic eruptions.

The result, which has been published recently in the Journal of Quaternary Science, is a map of volcanic hazards for Gran Canaria, describing risk scenarios.

"We have identified 24 volcanic eruptions that took place over the past 11,000 years on Gran Canaria. We know that volcanism was concentrated in the northern sector of the island and produced small monogenetic strombolian cones (eruptions that are not very violent and which release lava and pyroclastic flows) and, occasionally, phreatomagmatic calderas (which release ash), Alejandro Rodriguez-Gonzalez, lead author of the study and a researcher at the ULPGC, tells SINC.

In order to create the map, the researchers based themselves on detailed field work, which enabled them to define the limits of the various volcanic units (cone, lava and horizontal spread of pyroclastic flows) with a great degree of exactitude, using geomorphologiccal and stratigraphic criteria.

The data now made available by the scientists makes it possible to better evaluate the scale and type of future eruptions in this area. By working out the areas, before and after, of each eruption using Digital Land Models (DLM), the researchers have developed a novel and very detailed morphometric methodology for this kind of volcanic environment.

The study started with palaeotopographical reconstructions of areas affected by recent volcanic activity. "This allows our methodology to show geomorphological changes according to volcanic type and the periods of erosion involved", explains Rodriguez-Gonzalez.

Tuesday, September 29, 2009

Iran's Hidden Nuclear Facility - Interactive MAP Feature - NYTimes.com

Iran?s Hidden Nuclear Facility - Interactive Feature - NYTimes.com

Iran's Hidden Nuclear Facility

Images show the details of a hidden facility in Iran that experts say is the nuclear site recently disclosed by the Obama administration. Information about the plant is from an analysis by IHS Jane's.

Shared via AddThis

Monday, April 6, 2009

A new Cosmic map

The new survey mapped the positions of more than 100,000 galaxies. The black strips are areas the survey did not cover because matter in our own galaxy blocked the view (Illustration: Chris Fluke/Swinburne University of Technology)

The new survey mapped the positions of more than 100,000 galaxies. The black strips are areas the survey did not cover because matter in our own galaxy blocked the view (Illustration: Chris Fluke/Swinburne University of Technology)