Showing posts with label SDO. Show all posts

Tuesday, January 20, 2015

NASA SDO: Sun Monitoring Satellite captures 100 millionth image

The Atmospheric Imaging Assembly on NASA's Solar Dynamics Observatory captured its 100 millionth image of the sun on Jan. 19, 2015. 

The dark areas at the bottom and the top of the image are coronal holes, areas of less dense gas, where solar material has flowed away from the sun. 

Credit: NASA/SDO/AIA/LMSAL

On Jan. 19, 2015, at 12:49 p.m. EST, an instrument on NASA's Solar Dynamics Observatory captured its 100 millionth image of the sun.

The instrument is the Atmospheric Imaging Assembly (AIA), which uses four telescopes working parallel to gather eight images of the sun, cycling through 10 different wavelengths -- every 12 seconds.

The Atmospheric Imaging Assembly (AIAimages the solar atmosphere in multiple wavelengths to link changes in the surface to interior changes. 

Data includes images of the Sun in 10 wavelengths every 10 seconds. 

Credit: NASA SDO, Lockheed Martin Solar Astrophysics Laboratory

The Helioseismic and Magnetic Imager extends the capabilities of the SOHO/MDI instrument with continual full-disk coverage at higher spatial resolution and new vector magnetogram capabilities.

Credit: NASA SDO, Lockheed Martin Solar Astrophysics Laboratory

Between the AIA and two other instruments on board, the Helioseismic Magnetic Imager (HMI) and the Extreme Ultraviolet Variability Experiment (EVE), SDO sends down a whopping 1.5 terabytes of data a day.

The Extreme Ultraviolet Variability Experiment measures the solar extreme-ultraviolet (EUV) irradiance with unprecedented spectral resolution, temporal cadence, and precision. 

EVE measures the solar extreme ultraviolet (EUV) spectral irradiance to understand variations on the timescales which influence Earth's climate and near-Earth space.

Credit: NASA SDO, Lockheed Martin Solar Astrophysics Laboratory

AIA is responsible for about half of that. Every day it provides 57,600 detailed images of the sun that show the dance of how solar material sways and sometimes erupts in the solar atmosphere, the corona.

In the almost five years since its launch on Feb. 11, 2010, SDO has provided images of the sun to help scientists better understand how the roiling corona gets to temperatures some 1000 times hotter than the sun's surface, what causes giant eruptions such as solar flares, and why the sun's magnetic fields are constantly on the move.

Saturday, November 1, 2014

NASA SDO: Tracking a gigantic sunspot across the Sun

Super sunspot AR2192 produced 10 significant solar flare while traversing the Earth-side of the sun; six X-class and four above M5-class. 

Credit: NASA/SDO

An active region on the sun, an area of intense and complex magnetic fields, rotated into view on Oct. 18, 2014.

Labeled AR2192, it soon grew into the largest such region in 24 years, and fired off 10 sizable solar flares as it traversed across the face of the sun.

The region was so large it could be seen without a telescope for those looking at the sun with eclipse glasses, as many did during a partial eclipse of the sun on Oct. 23.

"Despite all the flares, this region did not produce any significant coronal mass ejections," said Alex Young a solar scientist at NASA's Goddard Space Flight Center in Greenbelt, Maryland."

"Coronal mass ejections, or CMEs, are giant clouds of solar particles that can affect technology when they reach near-Earth space."

"You certainly can have flares without CMEs and vice versa, but most big flares do have CMEs. So we're learning that a big active region doesn't always equal the biggest events."

The largest sunspot since November 1990 is seen traveling across the front of the sun in these images from NASA's SDO, captured Oct. 17-Oct 29, 2014. 

Credit: NASA/SDO

Such active regions are measured in millionths of a solar hemisphere, where 1 micro-hemisphere, or MH, is about 600,000 square miles.

This region topped out at 2,750 MH, making it the 33rd largest region out of approximately 32,000 active regions that have been tracked and measured since 1874.

It is the largest sunspot seen since AR 6368, which measured 3,080 MH on Nov. 18, 1990.

The largest five active regions ever observed were between 4,000 and more than 6,000 MH and they all appeared between 1946 and 1951.

On the other hand, the region that produced one of the biggest solar flares of all time on Sep. 1, 1859, in what's known as the Carrington event, wasn't even one of the top 50 at only 2,300 MH.

During its trip across the front of the sun, AR 12192 produced six X-class flares, which are the largest flares, and four strong M-class flares. M-class flares are one tenth as strong as X-class flares.

The number provides more information about its strength. An M2 is twice as intense as an M1, an M3 is three times as intense, etc.

"Having so many similar flares from the same active region will be a nice case study for people who work on predicting solar flares," said Dean Pesnell, project scientist for NASA's Solar Dynamics Observatory at Goddard.

"This is important for one day improving the nation's ability to forecast space weather and protect technology and astronauts in space."


This movie shows fireworks on the sun as 10 significant flares erupted on the sun from Oct. 19-28, 2014. 

The graph shows X-ray output from the sun as measured by NOAA’s GOES spacecraft. The X-rays peak in sync with each flare. 

Credit:  NASA/SDO/NOAA/GOES

AR 12192 rotated onto the far side of the sun on Oct. 30, 2014, however as it evolves, we may see a new version of it rotating back into view in two weeks.

Wednesday, October 22, 2014

NASA SDO: Electromagnetic 'Twisted rope' clue to dangerous solar storms

Model of the magnetic field in the region where occurred a major flare on December 13th 2006. 

This model has been obtained using magnetic field data obtained at the surface of the Sun by the satellite HINODE and the high resolution model MESHMHD few hours before the eruption. 

It shows that a magnetic rope (grey) is maintained in equilibrium by overlaying arcades (orange). 

Credit: Tahar Amari /Centre de physique théorique.CNRS-Ecole Polytechnique.FRANCE.

A "twisted rope" of magnetically-charged energy precedes solar storms that have the potential to damage satellites and electricity grids, French scientists said on Wednesday.

A cord of magnetic flux emerges on the Sun's surface, grows and is squeezed upwards, and the following day, the star unleashes a blast of radiation, high-energy particles and magnetised plasma.

Solar outbursts are considered a rare but increasingly worrisome risk for satellites, global positioning systems (GPS) and power grids on which modern life depends.

Reporting in the journal Nature, a team led by Tahar Amari of France's National Centre for Scientific Research (CNRS) looked at a solar storm that brewed in December 2006 and happened to be observed by a Japanese scientific satellite.

"We were able to identify the source of the eruption four days before it developed," Amari said to reporters.

"The magnetic field builds up in the shape of a twisted rope. The ends of the rope are anchored in sunspots," he said, referring to notoriously magnetised features on the solar surface.

Experts say solar storms can cause widespread breakdowns, disabling everything from power and radio to GPS geo-location and water supplies which rely on electrical pumps.

View of typical solar eruption using data from the NASA Solar Dynamic Observatory space mission. 

The Earth has been shown to show the gigantic size of the phenomena 

Credit: Tahar Amari /Centre de physique théorique.CNRS-Ecole Polytechnique.FRANCE

They begin with an explosion on the Sun's surface, known as a solar flare, sending X-rays and extreme ultra-violet radiation towards Earth at light speed.

Hours later, energetic particles follow and these electrons and protons can electrify satellites and damage their electronics.

Next are coronal mass ejections (CME), billion-tonne clouds of magnetised plasma that take a day or more to cross the Sun-Earth gap.

A solar storm in 1859 caused an electrical surge on telegraph lines that prompted some offices to catch fire and operators to receive shocks. A 1989 event caused power outages for five million people in the Canadian province of Quebec.

A 2009 report by a panel of scientists assembled by NASA warned that a catastrophic solar storm could cost the United States alone up to two trillion dollars (1.6 trillion euros) in repairs in the first year, and it could take up to 10 years to fully recover.

Predicting when these events will take place, and if Earth lies in their path, has been thwart with problems.

Eruption of the magnetic rope in the dynamic model METEOSOL after its departure from equilibrium 

Credit: Tahar Amari /Centre de physique théorique.CNRS-Ecole Polytechnique.FRANCE

On July 23, 2012, Earth narrowly missed the biggest storm in 150 years, an event big enough to "knock modern civilisation back to the 18th century," yet few humans were even aware of the peril, NASA said last July.

At present, Earth gets a few hours' warning of a solar eruption thanks to the eyes of orbiting US satellites.

But, said Amari, warning time should eventually improve.

"The work will help us fine tune knowledge about impending solar eruptions," he said.

"Using real-time magnetic data and mathematical models, it will eventually be possible to predict space weather."

More information: Characterizing and predicting the magnetic environment leading to solar eruptions, Nature, dx.doi.org/10.1038/nature13815

Sunday, October 19, 2014

NASA SDO Detects an X1-class solar flare, Multiple Wavelengths - Video


An large sunspot (AR2192) emitted a X1-class solar flare on October 19th, 2014. NASA's Solar Dynamics Observatory (SDO) captured the fireworks. The blast site was not Earth-directed.

Saturday, October 18, 2014

NASA SDO: IRIS captures New information about sun's atmosphere

NASA’s Solar Dynamics Observatory provided the outer image of a coronal mass ejection on May 9, 2014. 

The IRIS mission views the interface region that lies between the sun’s photosphere and corona in unprecedented detail for researchers to study.

Credit: NASA, Lockheed Martin Solar & Astrophysics Laboratory

NASA's Interface Region Imaging Spectrograph (IRIS) has provided scientists with five new findings into how the sun's atmosphere, or corona, is heated far hotter than its surface, what causes the sun's constant outflow of particles called the solar wind, and what mechanisms accelerate particles that power solar flares.

The new information will help researchers better understand how our nearest star transfers energy through its atmosphere and track the dynamic solar activity that can impact technological infrastructure in space and on Earth.

Details of the findings appear in the current edition of Science "On the prevalence of small-scale twist in the solar chromosphere and transition region"DOI: 10.1126/science.1255732

"These findings reveal a region of the sun more complicated than previously thought," said Jeff Newmark, interim director for the Heliophysics Division at NASA Headquarters in Washington.

"Combining IRIS data with observations from other Heliophysics missions is enabling breakthroughs in our understanding of the sun and its interactions with the solar system."

The first result identified heat pockets of 200,000 degrees Fahrenheit, lower in the solar atmosphere than ever observed by previous spacecraft.

Scientists refer to the pockets as solar heat bombs because of the amount of energy they release in such a short time.

Identifying such sources of unexpected heat can offer deeper understanding of the heating mechanisms throughout the solar atmosphere.

For its second finding, IRIS observed numerous, small, low lying loops of solar material in the interface region for the first time.

The unprecedented resolution provided by IRIS will enable scientists to better understand how the solar atmosphere is energized.

A surprise to researchers was the third finding of IRIS observations showing structures resembling mini-tornadoes occurring in solar active regions for the first time.

These tornadoes move at speeds as fast as 12 miles per second and are scattered throughout the chromosphere, or the layer of the sun in the interface region just above the surface.

These tornados provide a mechanism for transferring energy to power the million-degree temperatures in the corona.

Another finding uncovers evidence of high-speed jets at the root of the solar wind. The jets are fountains of plasma that shoot out of coronal holes, areas of less dense material in the solar atmosphere and are typically thought to be a source of the solar wind.

The final result highlights the effects of nanoflares throughout the corona. Large solar flares are initiated by a mechanism called magnetic reconnection, whereby magnetic field lines cross and explosively realign.

These often send particles out into space at nearly the speed of light. Nanoflares are smaller versions that have long been thought to drive coronal heating.

IRIS observations show high energy particles generated by individual nanoflare events impacting the chromosphere for the first time.

"This research really delivers on the promise of IRIS, which has been looking at a region of the sun with a level of detail that has never been done before," said De Pontieu, IRIS science lead at Lockheed Martin in Palo Alto, California.

"The results focus on a lot of things that have been puzzling for a long time and they also offer some complete surprises."

More Information
Science "On the prevalence of small-scale twist in the solar chromosphere and transition region"DOI: 10.1126/science.1255732

Thursday, October 9, 2014

NASA Science Fleet: Comet Siding Spring C/2013 A1


Credit: NASA

NASA's extensive fleet of science assets, particularly those orbiting and roving Mars, have front row seats to image and study a once-in-a-lifetime comet flyby on Sunday, Oct. 19.

Comet C/2013 A1, also known as comet Siding Spring, will pass within about 87,000 miles (139,500 kilometers) of the Red Planet, less than half the distance between Earth and our moon and less than one-tenth the distance of any known comet flyby of Earth.

Siding Spring's nucleus will come closest to Mars around 2:27 p.m. EDT, hurtling at about 126,000 mph (56 kilometers per second).

This proximity will provide an unprecedented opportunity for researchers to gather data on both the comet and its effect on the Martian atmosphere.

"This is a cosmic science gift that could potentially keep on giving, and the agency's diverse science missions will be in full receive mode," said John Grunsfeld, astronaut and associate administrator for NASA's Science Mission Directorate in Washington.

"This particular comet has never before entered the inner solar system, so it will provide a fresh source of clues to our solar system's earliest days."

Siding Spring came from the Oort Cloud, a spherical region of space surrounding our sun and occupying space at a distance between 5,000 and 100,000 astronomical units.

It is a giant swarm of icy objects believed to be material left over from the formation of the solar system.

Siding Spring will be the first comet from the Oort Cloud to be studied up close by spacecraft, giving scientists an invaluable opportunity to learn more about the materials, including water and carbon compounds, that existed during the formation of the solar system 4.6 billion years ago.

Some of the best and most revealing images and science data will come from assets orbiting and roving the surface of Mars.

Mars Atmosphere and Volatile EvolutioN (MAVEN)
In preparation for the comet flyby, NASA maneuvered its Mars Odyssey orbiter, Mars Reconnaissance Orbiter (MRO), and the newest member of the Mars fleet, Mars Atmosphere and Volatile EvolutioN (MAVEN), to reduce the risk of impact with high-velocity dust particles coming off the comet.

The period of greatest risk to orbiting spacecraft will start about 90 minutes after the closest approach of the comet's nucleus and will last about 20 minutes, when Mars will come closest to the center of the widening trail of dust flying from the comet's nucleus.

"The hazard is not an impact of the comet nucleus itself, but the trail of debris coming from it. Using constraints provided by Earth-based observations, the modeling results indicate that the hazard is not as great as first anticipated."

"Mars will be right at the edge of the debris cloud, so it might encounter some of the particles, or it might not," said Rich Zurek, chief scientist for the Mars Exploration Program at NASA's Jet Propulsion Laboratory (JPL) in Pasadena, California.

The atmosphere of Mars, though much thinner that Earth's, will shield NASA Mars rovers Opportunity and Curiosity from comet dust, if any reaches the planet. Both rovers are scheduled to make observations of the comet.

NASA's Mars orbiters will gather information before, during and after the flyby about the size, rotation and activity of the comet's nucleus, the variability and gas composition of the coma around the nucleus, and the size and distribution of dust particles in the comet's tail.

Observations of the Martian atmosphere are designed to check for possible meteor trails, changes in distribution of neutral and charged particles, and effects of the comet on air temperature and clouds.

MAVEN will have a particularly good opportunity to study the comet, and how its tenuous atmosphere, or coma, interacts with Mars' upper atmosphere.

Earth-based and space telescopes, including NASA and ESA's iconic Hubble Space Telescope, also will be in position to observe the unique celestial object.

The agency's astrophysics space observatories, Kepler, Swift, Spitzer, Chandra, and the ground-based Infrared Telescope Facility on Mauna Kea, Hawaii, also will be tracking the event.

NASA's asteroid hunter, the Near-Earth Object Wide-field Infrared Survey Explorer (NEOWISE), has been imaging, and will continue to image, the comet as part of its operations, and the agency's two Heliophysics spacecraft, Solar TErrestrial RElations Observatory (STEREO) and Solar and Heliophysics Observatory (SOHO), also will image the comet.

The agency's Balloon Observation Platform for Planetary Science (BOPPS), a sub-orbital balloon-carried telescope, already has provided observations of the comet in the lead-up to the close encounter with Mars.

Images and updates will be posted online before and after the comet flyby. Several pre-flyby images of Siding Spring, as well as information about the comet and NASA's planned observations of the event, are available online.

Saturday, October 4, 2014

NASA SDO: Incredible Solar Flare Video Captured


A NASA satellite charged with staring at the sun captured an incredible view of a powerful solar flare on Thursday (Oct. 2).

The space agency's Solar Dynamics Observatory (SDO) caught sight of the flare as it erupted from an active region on the right side of the sun, according to NASA.

The spacecraft' spectacular videos of the solar flare, as well as still images, show the sun storm erupting from the sunspot AR2172-AR2173.

The flare reached its peak at 3:01 p.m. EDT (1901 GMT) on Tuesday. While the M7.3-class flare did cause a coronal mass ejection, an explosion of super-hot solar plasma, the eruption was not directed at Earth, and should not pose a concern for satellites in orbit or the planet as a whole, according to the National Oceanic and Atmospheric Administration's (NOAA) Space Weather Prediction Office.

NASA's Solar Dynamics Observatory captured this photo of an M7.3-class solar flare erupting from the sun on Oct. 2, 2014.

Credit: NASA/SDO

M-class flares are about one-tenth as powerful as the strongest solar flares, which are known as X-class flares.

"Harmful radiation from a flare cannot pass through Earth's atmosphere to physically affect humans on the ground. However, when intense enough, they can disturb the atmosphere in the layer where GPS and communications signals travel," NASA Goddard Space Flight Center spokeswoman Karen Fox wrote in a statement.

The sun has unleashed a series of X-class flares this year. In early September, the star fired off two large flares in rapid succession.

Those solar storms, which were pointed toward Earth, created some amazing aurora displays. Powerful solar tempests can supercharge Earth's auroras, causing curtains of green light to dance in the skies of the high northern and southern latitudes.

The northern lights are created when charged particles from the sun interact with Earth's upper atmosphere, bombarding neutral particles and creating the lights of the auroras.

Tuesday, September 30, 2014

NASA SDO: Sounding rocket has 6 mins to study Solar Heating

A view of the sun from Sept. 24, 2014 from NASA's Solar Dynamics Observatory shows bright spots representing magnetically active regions in the lower right quadrant of the sun. 

The VAULT2.0 mission will focus on this area to better understand what heats the solar atmosphere. 

Credit: NASA/SDO

On Sept. 30, 2014, a sounding rocket will fly up into the sky,  past Earth's atmosphere that obscures certain wavelengths of light from the sun, for a 15-minute journey to study what heats up the sun's atmosphere.

This is the fourth flight for the Very high Angular Resolution Ultraviolet Telescope (VAULT), will launch from the White Sands Missile Range near Las Cruces, New Mexico.

The instrument, now called VAULT 2.0, has been refurbished with new electronics and an imaging detector to capture images more frequently than before.

While in space, VAULT 2.0 will observe light emitted from hydrogen atoms at temperatures of 18,000 to 180,000 degrees Fahrenheit.

"That's the temperature range where the action is," said Angelos Vourlidas, the principal investigator for VAULT 2.0 at the Naval Research Laboratory in Washington, D.C.

"These are the temperatures where the heating of the sun's atmosphere, the corona, really takes place."

Understanding how the corona heats remains one of the great, unanswered questions on the sun.

The solar surface itself is only about 10,500 F, but further up in the atmosphere, the temperatures rise to million of degrees Fahrenheit, the opposite of what one typically expects when moving away from a heat source.

Something heats up that corona, and VAULT 2.0 will be watching.

The sounding rocket will fly up to about 180 miles in the air, just below the height where the International Space Station travels. It will fly in an arc, taking 15 minutes from launch to landing back on the ground.

This allows for just six minutes of actual observations while it is above the atmosphere, during which VAULT 2.0 will capture an image every six to eight seconds.

Vourlidas plans to focus the telescope on active regions at the center of the sun, areas of intense and complex magnetic activity, to understand the heating process there.

NASA's Interface Region Imaging Spectrograph (IRIS)
During the VAULT 2.0 launch, three other observatories will watch the same area: NASA's Interface Region Imaging Spectrograph (IRIS), the joint Japanese Exploration Agency (JAXA) and NASA's Hinode, and NASA's Solar Dynamics Observatory (SDO).

IRIS focuses on solar material slightly hotter than does VAULT 2.0, while Hinode can see solar material both cooler and much hotter.

The temperatures also loosely correlate to heights in the atmosphere with the cooler temperatures at the bottom, and the hotter temperatures higher up.

SDO will observe the larger scale structure of the solar atmosphere as well as the underlying magnetic field.

"Together the three telescopes will be looking at a sandwich of solar material," said Vourlidas.

"We'll be looking at the layers from near the surface all the way up into the corona, the layers where the bulk of coronal heating is believed to happen."

VAULT's launch time is planned for 1:47 p.m. EDT on Sept. 30. Launch timing will depend on good weather conditions as well as optimum times for coordinating with Hinode satellite and IRIS spacecraft.

Thursday, September 11, 2014

NASA IRIS Mission: X-Flare - Close-up of Sunspot - Video


NASA's Interface Region Imaging Spectrograph (IRIS) mission can only study small areas of the Sun's surface at a time.

This week’s mission planner pointed the probe at promising sunspot AR2158 just in time for an X1.6-class flare.

Searing plasma "lines" spark and shift at several hundred miles per hour during the flare.


Sun Unleashes Major Solar Flare at Earth.

A coronal mass ejection burst off the side of the sun on May 9, 2014. The giant sheet of solar material erupting was the first CME seen by NASA's Interface Region Imaging Spectrograph (IRIS).

The field of view seen here is about five Earth's wide and about seven and a half Earth's tall.

Wednesday, September 3, 2014

Intense Solar Eruption Captured by NASA SDO Spacecraft - Video


A huge tendril of super-hot plasma that had been creeping across the face of the sun erupted Tuesday (Sept. 2) in a striking solar storm that may send a wave of charged particles in Earth's direction.

Video of the solar eruption captured by NASA's sun-watching Solar Dynamics Observatory (SDO) shows a cloud of solar plasma being hurled from the sun's surface during the rippling blast.

Debris from the solar explosion could be traveling in the direction of Earth, according to Spaceweather.com, which tracks stargazing and space weather events.

Further observations should confirm whether the eruption was actually an Earth-directed coronal mass ejection, or CME.

CMEs occur when the sun's magnetic field lines become so warped that they snap like rubber bands then reconnect at other points.

These breaks can leave gaps where the sun's plasma spews into space.

CMEs can occasionally spark geomagnetic storms when they collide with Earth.

These disturbances can interfere with electronics, cause radio blackouts and produce stunning auroras.

In the days before the eruption, the filament of dark plasma looked like a long shadow on the sun that stretched some 372,823 miles (600,000 kilometers), that's more than three times the diameter of Jupiter, the largest planet in the solar system.

Amateur astrophotographers from around the world had been sending Spaceweather.com amazing amazing images of the filament over the past few days.

Thursday, August 21, 2014

NASA Studies of the ultraviolet sun

Four of the telescopes on the Solar Dynamics Observatory observe extreme ultraviolet light activity on the sun that is invisible to the naked eye. 

Credit: NASA/SDO

You cannot look at the sun without special filters, and the naked eye cannot perceive certain wavelengths of sunlight.

Solar physicists must consequently rely on spacecraft that can observe this invisible light before the atmosphere absorbs it.

"Certain wavelengths either do not make it through Earth's atmosphere or cannot be seen by our eyes, so we cannot use normal optical telescopes to look at the spectrum," said Dean Pesnell, the project scientist for the Solar Dynamics Observatory (SDO), at NASA's Goddard Space Flight Center in Greenbelt, Maryland.

Several spacecraft can observe these invisible light wavelengths. SDO for example has four telescopes that image the sun in the ultraviolet spectrum.

As beams of ultraviolet light pass into the telescope, a mirror with special coatings filters and amplifies the ultraviolet light's otherwise poor reflection.

The incoming photons are then recorded as pixels and converted into electrical signals, similar to how your cell phone camera sees visible light.

"It's exactly the same process, whether it's ultraviolet light, infrared light, visible light, or radio," said Joseph Gurman, project scientist for both the Solar and Heliospheric Observatory (SOHO) and the Solar Terrestrial Relations Observatory (STEREO) at Goddard.

"In this case we're trying to understand how the sun changes and how those changes affect life here on Earth."

Ultraviolet light causes molecular radiation damage to our skin, seen as sunburns that can lead to cancer.

Its cousin, extreme ultraviolet radiation, and the associated solar storms have the potential to disrupt communications and spacecraft navigation.

"These are very damaging, energetic photons, and we want to understand what chain of events produces these photons," Pesnell said.

The Solar Dynamics Observatory (SDO) observed a solar flare (upper left) and a coronal mass ejection (right) erupting from the sun’s limb in extreme ultraviolet light on August 6, 2010. 

Credit: NASA/SDO

Thankfully our planet's atmosphere absorbs much of this solar radiation, making life on Earth possible.

However, this means that to study extreme ultraviolet light, instruments must do it from the vacuum of space.

"Ultraviolet light from the sun can show us the origins of solar storms that can lead to power outages, cell phone disruptions, and delays in shipping packages due to the rerouting of planes from over the pole," Gurman said.

By understanding what occurs in the sun's atmosphere, scientists hope to predict when powerful solar events such as coronal mass ejections and solar flares may occur.

Spacecraft record solar activity as a binary code, 1s and 0s, which computer programs can translate into black and white. 

Scientists coloroured the images for realism, and then zoom in on areas of interest. 

Credit: NASA/Karen Fox

"You really want to know what's happening on the sun as soon as you can," said Jack Ireland, a solar visualization specialist at Goddard.

"We can then use computer models to estimate how solar events will affect Earth's space environment."

The information can then be used by NOAA's Space Weather Prediction Center, in Boulder, Co. to alert power companies and airlines to take the necessary precautions, thus avoiding power outages and keeping airplane passengers safe.

Monday, August 11, 2014

NASA SDO captures long solar filament

Credit: SDO

A very long filament hung across the sun’s surface for over a week from July 31 to Aug. 6, 2014.

The filament appears as the dark line going diagonally across the center of the sun in this image.

Filaments consist of clouds of cooler gas raised above the sun’s surface by magnetic forces.

Normally they exhibit a great deal of instability and break apart in days or even hours.

This image was obtained in the 191 Angstrom wavelength of extreme ultraviolet light, and has been tinted red instead of the usual brown colour.

Saturday, August 2, 2014

NASA SDO: EUNIS mission - Coronal Heating theory detected

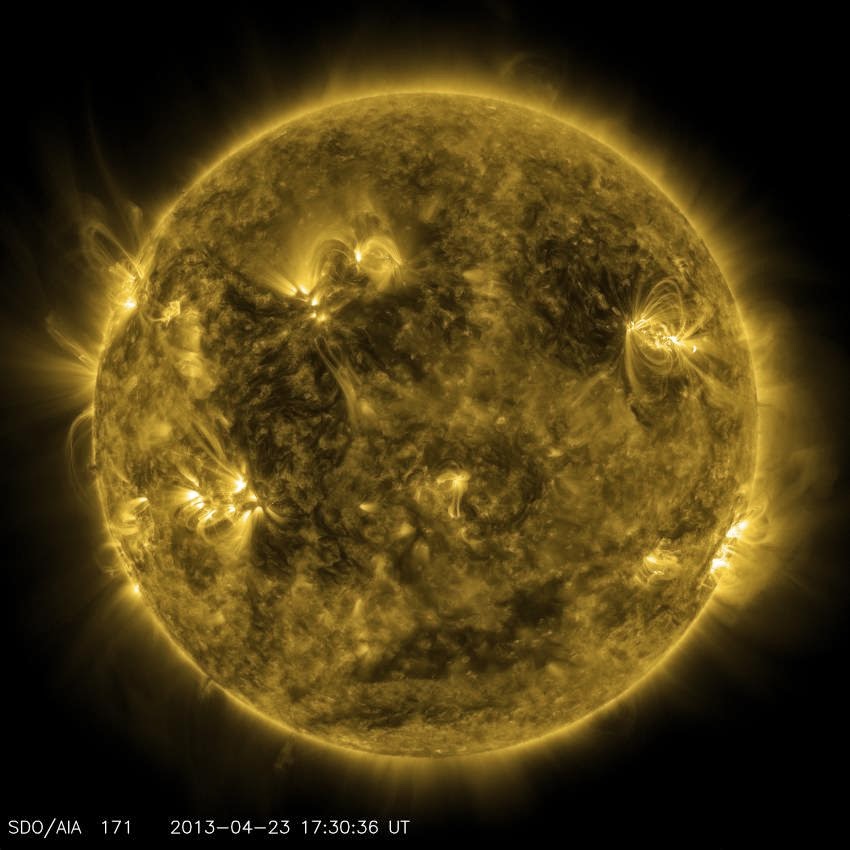
NASA's Solar Dynamics Observatory captured this image of what the sun looked like on April 23, 2013, at 1:30 p.m. EDT when the EUNIS mission launched. 

EUNIS focused on an active region of the sun, seen as bright loops in the upper right in this picture. 

Credit: NASA/SDO

Scientists have recently gathered some of the strongest evidence to date to explain what makes the sun's outer atmosphere so much hotter than its surface.

The new observations of the small-scale extremely hot temperatures are consistent with only one current theory: something called nanoflares; a constant peppering of impulsive bursts of heating, none of which can be individually detected, provide the mysterious extra heat

What's even more surprising is these new observations come from just six minutes worth of data from one of NASA's least expensive type of missions, a sounding rocket.

The Extreme Ultraviolet Normal Incidence Spectrograph (EUNIS) mission, launched on April 23, 2013, gathering a new snapshot of data every 1.3 seconds to track the properties of material over a wide range of temperatures in the complex solar atmosphere.

The sun's visible surface, called the photosphere, is some 6,000 Kelvins, while the corona regularly reaches temperatures which are 300 times as hot.

Jeff Brosius
"That's a bit of a puzzle," said Jeff Brosius, a space scientist at Catholic University in Washington, D.C., and NASA's Goddard Space Flight Center in Greenbelt, Maryland.

"Things usually get cooler farther away from a hot source. When you're roasting a marshmallow you move it closer to the fire to cook it, not farther away."

Brosius is the first author of a paper on these results appearing in the Aug. 1, 2014, edition of The Astrophysical Journal.

Several theories have been offered for how the magnetic energy coursing through the corona is converted into the heat that raises the temperature.

Different theories make different predictions about what kind of, and what temperature, material might be observable, but few observations have high enough resolution over a large enough area to distinguish between these predictions.


NASA's EUNIS sounding rocket mission spotted evidence to explain why the sun's atmosphere is so much hotter than its surface. 

Credit: NASA/Goddard/Duberstein 

The EUNIS sounding rocket, however, was equipped with a very sensitive version of an instrument called a spectrograph.

Spectrographs gather information about how much material is present at a given temperature, by recording different wavelengths of light.

To observe the extreme ultraviolet wavelengths necessary to distinguish between various coronal heating theories, such an instrument can only work properly in space, above the atmosphere surrounding Earth that blocks that ultraviolet light.

The EUNIS team stands in front of the sounding rocket before its second launch on Nov. 6, 2007. 

The mission will launch again for a six-minute flight to observe the sun on December 15, 2012. 

Credit: U.S. Navy

So EUNIS flew up nearly 200 miles above the ground aboard a sounding rocket, a type of NASA mission that flies for only 15 minutes or so, and gathered about six minutes worth of observations from above the planet's air.

During its flight, EUNIS scanned a pre-determined region on the sun known to be magnetically complex, a so-called active region, which can often be the source of larger flares and coronal mass ejections.

As light from the region streamed into its spectrograph, the instrument separated the light into its various wavelengths.

Instead of producing a typical image of the sun, the wavelengths with larger amounts of light are each represented by a vertical line called an emission line.

Each emission line, in turn, represents material at a unique temperature on the sun. Further analysis can identify the density and movement of the material as well.

The EUNIS spectrograph was tuned into a range of wavelengths useful for spotting material at temperatures of 10 million Kelvin; temperatures that are a signature of nanoflares.

Unlike a conventional image, NASA's Extreme Ultraviolet Normal Incidence Spectrograph will provide what's known as "spectra" such as above, which show lines to highlight which wavelengths of light are brighter than others. 

That information, in turn, corresponds to which elements are present in the sun's atmosphere and at what temperature. 

Credit: NASA/EUNIS

Scientists have hypothesised that a myriad of nanoflares could heat up solar material in the atmosphere to temperatures of up to 10 million Kelvins.

This material would cool very rapidly, producing ample solar material at the 1 to 3 million degrees regularly seen in the corona.

However, the faint presence of that extremely hot material should remain. Looking over their six minutes of data, the EUNIS team spotted a wavelength of light corresponding to that 10 million degree material.

To spot this faint emission line was a triumph of the EUNIS instrument's resolution. The spectrograph was able to clearly and unambiguously distinguish the observations representing the extremely hot material.

"The fact that we were able to resolve this emission line so clearly from its neighbours is what makes spectroscopists like me stay awake at night with excitement," said Brosius.

"This weak line observed over such a large fraction of an active region really gives us the strongest evidence yet for the presence of nanoflares."

The EUNIS experiment undergoing tests before launch. 

Credit: NASA

There are a variety of theories for what mechanisms power these impulsive bursts of heat, the nanoflares.

Moreover, other explanations have been offered for what is heating the corona.

Scientists will continue to explore these ideas further, gathering additional observations as their tools and instruments improve.

However, no other theory predicts material of this temperature in the corona, so this is a strong piece of evidence in favour of the nanoflare theory.

Adrian Daw
"This is a real smoking gun for nanoflares," said Adrian Daw, the current principal investigator for EUNIS at Goddard. "And it shows that these smaller, less expensive sounding rockets can produce truly robust science."

In addition to having a lower cost, sounding rockets offer a valuable test bed for new technology that may subsequently be flown on longer-term space missions.

Another advantage of sounding rockets is that the instruments parachute back to the ground so they can be recovered and re-used.

The EUNIS mission will be re-tuned to focus on a different set of solar wavelengths; ones that can also spot the extremely high temperature material representative of nanoflares, and fly again sometime in 2016.

More Information: Pervasive Faint Fe XIX Emission from a Solar Active Region Observed with EUNIS-13: Evidence for Nanoflare Heating - Jeffrey W. Brosius et al. 2014 ApJ 790 112. doi:10.1088/0004-637X/790/2/112

Friday, July 25, 2014

NASA SDO STEREO: Earth survived near-miss during 2012 solar storm

Photo released by Nasa Earth Observatory on June 7, 2011 and taken from Nasa's Solar Dynamics Observatory (SDO) shows the Sun unleashing a solar flare, radiation storm and a coronal mass ejection

Credit: NASA SDO

Back in 2012, the Sun erupted with a powerful solar storm that just missed the Earth but was big enough to "knock modern civilization back to the 18th century," NASA said.

The extreme space weather that tore through Earth's orbit on July 23, 2012, was the most powerful in 150 years, according to a statement posted on the US space agency website Wednesday.

However, few Earthlings had any idea what was going on.

"If the eruption had occurred only one week earlier, Earth would have been in the line of fire," said Daniel Baker, professor of atmospheric and space physics at the University of Colorado.

Instead the storm cloud hit the STEREO-A spacecraft, a solar observatory that is "almost ideally equipped to measure the parameters of such an event," NASA said.

Scientists have analyzed the treasure trove of data it collected and concluded that it would have been comparable to the largest known space storm in 1859, known as the Carrington event.

It also would have been twice as bad as the 1989 solar storm that knocked out power across Quebec, scientists said.

"I have come away from our recent studies more convinced than ever that Earth and its inhabitants were incredibly fortunate that the 2012 eruption happened when it did," said Baker.

The National Academy of Sciences has said the economic impact of a storm like the one in 1859 could cost the modern economy more than two trillion dollars and cause damage that might take years to repair.

Experts say solar storms can cause widespread power blackouts, disabling everything from radio to GPS communications to water supplies, most of which rely on electric pumps.

They begin with an explosion on the Sun's surface, known as a solar flare, sending X-rays and extreme UV radiation toward Earth at light speed.

Hours later, energetic particles follow and these electrons and protons can electrify satellites and damage their electronics.

Next are the coronal mass ejections, billion-ton clouds of magnetized plasma that take a day or more to cross the Sun-Earth divide.

These are often deflected by Earth's magnetic shield, but a direct hit could be devastating.

There is a 12 percent chance of a super solar storm the size of the Carrington event hitting Earth in the next 10 years, according to physicist Pete Riley, who published a paper in the journal Space Weather on the topic.

His research was based on an analysis of solar storm records going back 50 years.

"Initially, I was quite surprised that the odds were so high, but the statistics appear to be correct," said Riley.

"It is a sobering figure."

Tuesday, July 22, 2014

The sun has gone quiet: Sunspots and CME

The Sun by the Atmospheric Imaging Assembly of NASA's Solar Dynamics Observatory

Credit: NASA

The sun has gone quiet. Almost too quiet.

A few weeks ago it was teeming with sunspots, as you would expect since we are supposed to be in the middle of solar maximum-the time in the sun's 11-year cycle when it is the most active but now, there is hardly a sunspot in sight.

In an image taken Friday by NASA's Solar Dynamics Observatory, there is a tiny smidgen of brown just right of center where a small sunspot appears to be developing. But just one day before, there was nothing. It was a totally spotless day.

So what's going on here? Is the "All Quiet Event" as solar physicist Tony Phillips dubbed it, a big deal, or not?

"It is weird, but it's not super weird," said Phillips, who writes about solar activity on his web site SpaceWeather.com.

"To have a spotless day during solar maximum is odd, but then again, this solar maximum we are in has been very wimpy."

Phillips notes that this is the weakest solar maximum to have been observed in the space age, and it is shaking out to be the weakest one in the past 100 years, so the spotless day was not so totally out of left field.

"It all underlines that solar physicists really don't know what the heck is happening on the sun," Phillips said.

"We just don't know how to predict the sun, that is the take away message of this event."

Sunspots are interesting to solar observers because they are the region of the sun where solar activity such as solar flares (giant flashes of light) and coronal mass ejections (when material from the sun goes shooting off into space) originate.

They are caused by highly concentrated magnetic fields that are slightly cooler than the surrounding surface of the sun, which is why they appear dark to us.

Those intense magnetic fields can get twisted up and tangled, which causes a lot of energy to build up. Solar flares and coronal mass ejections occur when that energy is released in a very explosive way.

Alex Young, a heliophysicist at Goddard Space Flight Center, said it is hard to say what is and isn't unusual when it comes to the sun.

"We've only been observing the sun in lots of detail in the last 50 years," he said.

"That's not that long considering it's been around for 4.5 billion years." And it's not like astronomers have never seen the sun this quiet before.

Three years ago, on Aug. 14, 2011 it was completely free of sunspots and, as Phillips points out, that year turned out to have relatively high solar activity overall with several X-class flares.

So in that case, the spotless sun was just a "temporary intermission," as he writes on his web site.

Whether this quiet period will be similarly short-lived or if it will last longer remains to be seen.

"You just can't predict the sun," Phillips said.

Friday, July 4, 2014

Under the bright lights of an aging sun

Venus can be seen as a black dot eclipsing the Sun in this image from 2012. 

Venus orbits too close to the Sun to the planet to be habitable for life as we know it. 

Venus experiences a runaway greenhouse and the average surface temperatures are thought to be around 864ºF. 

Credit: NASA/SDO & the AIA, EVE, and HMI teams; Digital Composition: Peter L. Dove

Life as we know it on Earth is linked to our star, the Sun, which provides our planet with just the right amount of heat and energy for liquid water to be stable in our lakes, rivers and oceans.

However, as the Sun ages, it is steadily growing brighter and brighter. Eventually, the sunlight that supports life will become too great, and it will bring an end to habitability on our planet.

A Star is Born and Ages
The Sun formed some 4.5 billion years ago when gravitational attraction caused a massive cloud of gas and dust to collapse.

Currently the Sun is stable and has been for billions of years. The bright ball of light in our sky goes about its days generating energy by fusing hydrogen atoms in its core.

As the Sun ages it will enter another stage of stellar evolution where it's atmosphere begins to inflate. This is when the Sun will expand into a red giant star, swallowing planets in the inner Solar System, possibly including the Earth.

As time goes on, the Sun will start shedding its atmosphere and will continue to grow into a massive planetary nebula, which is like a large cloud of gas ejected from the old star.

This is a sort of recycling stage, where elements created by the star are sent back to the interstellar medium, thereby providing new materials for more stars to form.

Next, the old core of the Sun will cool and collapse into a dense but small hunk of mass known as a white dwarf star.

Eventually, it will cool to the point where only a cold, dark husk remains.
Life as we know it is intrinsically tied to the life-cycle of the Sun because we rely on its light for energy. Right now, things are perfect for biology. In the future, this will change dramatically.

As the Sun heats up and expands, life on Earth will become increasingly difficult. Long before the Sun becomes a red giant some 4 or 5 billion years from now, our planet will be rendered uninhabitable.

Dying in a Future Solar System
The fate of the Earth as the Sun grows old is not an old topic. For decades, scientists have studied various scenarios for how an ageing Sun will affect Earth's future habitability. Writers and artists, on the other hand, have explored the idea for centuries.

However, humankind will be gone long before a red giant star fills our skies.

Rather than leading us to a rocky ball of ice, an ageing Sun will instead blast the Earth with ever-increasing heat. Before the Sun expands to a red giant, this increased heat will cause dramatic climatic change on our planet.

The Atmosphere in 3-D
Previous models have predicted that an increase of just 6 percent in the solar constant (a measure of incoming solar electromagnetic radiation) would cause a runaway greenhouse effect on Earth that would render the planet uninhabitable as the oceans boil away to space.

Based on this number, Earth's habitability could come to an end in around 650 million years from now. However, a more recent study has extended the expected lifetime of Earth as a habitable world.

Discover the lifecycle of stars with this activity and handout. 

Many people think the different stages in the life of a star are actually different types of stars, rather than just stages in the life of a single star. 

Credit: NASA/JPL, Astronomical Society of the Pacific

New research shows that the accuracy of previous studies, which were based on 'one-dimensional' models of Earth's climate, could be improved.

"One-dimensional models treat the atmosphere as a single vertical column. This single column is meant as a representative average of all points on the Earth," explains Eric Wolf of the Department of Atmospheric and Oceanic Sciences at the University of Colorado Boulder.

"While one-dimensional models can treat radiative transfer well (i.e. solar energy and the greenhouse effect), they completely ignore many important aspects such as clouds, dynamics, and the pole to equator gradients of energy which ultimately describe our climate."

Wolf and his colleague Brian Toon, also of UC Boulder, used complex, three-dimensional climate models in order to bring more detail into the picture.

"Three-dimensional models, as we refer to them, are general circulation models of climate. They include a fully, spatially-resolved, rotating planet, with clouds, oceans, sea-ice, weather, etc.," Wolf told Astrobiology Magazine.

"The three-dimensional general circulation model I used has also been used for problems of modern climate. General circulation models are considered the most advanced type of climate models."

The added detail of the 3-D models showed that the Earth could remain habitable for longer than previously expected.

"According to my work, the Earth may remain 'habitable' for at least another 1.5 billion years, when the Sun is approximately 15.5 percent brighter than today," said Wolf. "This is the limit of our current study."

It's important to note that a habitable Earth in terms of astrobiology is not necessarily habitable for human beings.

Read the full article here