Showing posts with label plasma. Show all posts

Saturday, October 18, 2014

NASA SDO: IRIS captures New information about sun's atmosphere

NASA’s Solar Dynamics Observatory provided the outer image of a coronal mass ejection on May 9, 2014. 

The IRIS mission views the interface region that lies between the sun’s photosphere and corona in unprecedented detail for researchers to study.

Credit: NASA, Lockheed Martin Solar & Astrophysics Laboratory

NASA's Interface Region Imaging Spectrograph (IRIS) has provided scientists with five new findings into how the sun's atmosphere, or corona, is heated far hotter than its surface, what causes the sun's constant outflow of particles called the solar wind, and what mechanisms accelerate particles that power solar flares.

The new information will help researchers better understand how our nearest star transfers energy through its atmosphere and track the dynamic solar activity that can impact technological infrastructure in space and on Earth.

Details of the findings appear in the current edition of Science "On the prevalence of small-scale twist in the solar chromosphere and transition region"DOI: 10.1126/science.1255732

"These findings reveal a region of the sun more complicated than previously thought," said Jeff Newmark, interim director for the Heliophysics Division at NASA Headquarters in Washington.

"Combining IRIS data with observations from other Heliophysics missions is enabling breakthroughs in our understanding of the sun and its interactions with the solar system."

The first result identified heat pockets of 200,000 degrees Fahrenheit, lower in the solar atmosphere than ever observed by previous spacecraft.

Scientists refer to the pockets as solar heat bombs because of the amount of energy they release in such a short time.

Identifying such sources of unexpected heat can offer deeper understanding of the heating mechanisms throughout the solar atmosphere.

For its second finding, IRIS observed numerous, small, low lying loops of solar material in the interface region for the first time.

The unprecedented resolution provided by IRIS will enable scientists to better understand how the solar atmosphere is energized.

A surprise to researchers was the third finding of IRIS observations showing structures resembling mini-tornadoes occurring in solar active regions for the first time.

These tornadoes move at speeds as fast as 12 miles per second and are scattered throughout the chromosphere, or the layer of the sun in the interface region just above the surface.

These tornados provide a mechanism for transferring energy to power the million-degree temperatures in the corona.

Another finding uncovers evidence of high-speed jets at the root of the solar wind. The jets are fountains of plasma that shoot out of coronal holes, areas of less dense material in the solar atmosphere and are typically thought to be a source of the solar wind.

The final result highlights the effects of nanoflares throughout the corona. Large solar flares are initiated by a mechanism called magnetic reconnection, whereby magnetic field lines cross and explosively realign.

These often send particles out into space at nearly the speed of light. Nanoflares are smaller versions that have long been thought to drive coronal heating.

IRIS observations show high energy particles generated by individual nanoflare events impacting the chromosphere for the first time.

"This research really delivers on the promise of IRIS, which has been looking at a region of the sun with a level of detail that has never been done before," said De Pontieu, IRIS science lead at Lockheed Martin in Palo Alto, California.

"The results focus on a lot of things that have been puzzling for a long time and they also offer some complete surprises."

More Information
Science "On the prevalence of small-scale twist in the solar chromosphere and transition region"DOI: 10.1126/science.1255732

Saturday, May 31, 2014

NASA's IRIS: Observing a gigantic CME eruption of solar material

A coronal mass ejection, or CME, surged off the side of the sun on May 9, 2014, and NASA's newest solar observatory caught it in extraordinary detail. 

This was the first CME observed by the Interface Region Imaging Spectrograph (IRIS), which launched in June 2013 to peer into the lowest levels of the sun's atmosphere with better resolution than ever before. 

IRIS must commit to pointing at certain areas of the sun at least a day in advance, so catching a CME in the act involves some educated guesses and a little bit of luck.

"We focus in on active regions to try to see a flare or a CME," said Bart De Pontieu, the IRIS science lead at Lockheed Martin Solar & Astrophysics Laboratory in Palo Alto, California. "And then we wait and hope that we'll catch something. This is the first clear CME for IRIS so the team is very excited."

The IRIS imagery focuses in on material of 30,000 kelvins at the base, or foot points, of the CME.

The line moving across the middle of the movie is the entrance slit for IRIS's spectrograph, an instrument that can split light into its many wavelengths, a technique that ultimately allows scientists to measure temperature, velocity and density of the solar material behind the slit.

The field of view for this imagery is about five Earths wide and about seven-and-a-half Earths tall.


Watch the movie to see how a curtain of solar material erupts outward at speeds of 1.5 million miles per hour.

A coronal mass ejection burst off the side of the sun on May 9, 2014. The giant sheet of solar material erupting was the first CME seen by NASA's Interface Region Imaging Spectrograph (IRIS). 

The field of view seen here is about five Earths wide and about seven-and-a-half Earths tall. Credit: NASA/LMSAL/IRIS/SDO/Goddard


Wednesday, May 7, 2014

Sprites form at plasma irregularities in Earth's lower ionosphere

This is a photograph of a sprite. 

Credit: H. H. C. Stenbaek-Nielsen

Atmospheric sprites have been known for nearly a century, but their origins were a mystery.

Now, a team of researchers has evidence that sprites form at plasma irregularities and may be useful in remote sensing of the lower ionosphere.

Victor Pasko
"We are trying to understand the origins of this phenomenon," said Victor Pasko, professor of electrical engineering, Penn State.

"We would like to know how sprites are initiated and how they develop."

Sprites are an optical phenomenon that occur above thunderstorms in the D region of the ionosphere, the area of the atmosphere just above the dense lower atmosphere, about 37 to 56 miles above the Earth.

The ionosphere is important because it facilitates the long distance radio communication and any disturbances in the ionosphere can affect radio transmission.

Jianqi Qin
"In high-speed videos we can see the dynamics of sprite formation and then use that information to model and to reproduce the dynamics," said Jianqi Qin, postdoctoral fellow in electrical engineering, Penn State, who developed a model to study sprites.

Sprites occur above thunderstorms, but thunderstorms, while necessary for the appearance of a sprite, are not sufficient to initiate sprites. All thunderstorms and lightning strikes do not produce sprites.

Recent modeling studies show that plasma irregularities in the ionosphere are a necessary condition for the initiation of sprite streamers, but no solid proof of those irregularities existed.

This is a photograph of five plasma irregularities responsible for sprite initiation. 

Credit: H. H. C. Stenbaek-Niels

The researchers studied video observations of sprites, developed a model of how sprites evolve and disappear, and tested the model to see if they could recreate sprite-forming conditions.

They report their results (May 7) in Nature Communications.

Sprites resemble reddish orange jellyfish with bluish filamentary tendrils hanging down below.

Careful examination of videos of sprites forming showed that their downward hanging filaments form much more rapidly than in the horizontal spread, leading the researchers to suggest that localized plasma irregularities cause the streamers to propagate.

The researchers used a two-dimensional cylindrical symmetric plasma fluid model, a mathematical model of the ionization movements in the sprite, to study sprite dynamics.

They then used the model to recreate optical sprite creation. From this recreation, the researchers determined where the sprite streamers originated, and they could estimate the size of the plasma irregularity.

This is a sequence of black and white images of sprite initiation on July 20, 2012. 

Credit: H. H. C. Stenbaek-Nielsen

Monday, April 7, 2014

NASA SDO: M6-class Solar Flare Launches Super-Heated Plasma Into Space - Video


An M6-class flare erupted from a sunspot on the Sun on April 2nd, 2014 and was observed by NASA's Solar Dynamics Observatory (SDO). 

The bright magnetic burst is seen in two wavelengths of extreme ultraviolet light: 304 Angstroms and 171 Angstroms.


Thursday, May 2, 2013

NASA SDO Captures Giant Solar Wave Eruption on Video


The sun celebrated May Day with a spectacular solar eruption Wednesday, unleashing a colossal wave of super-hot plasma captured on camera by a NASA spacecraft.

The solar eruption occurred over a 2.5-hour period Wednesday (May 1) and appeared as a "gigantic rolling wave" on the sun in a video recorded by NASA's Solar Dynamics Observatory, agency officials said in an image description.

The solar eruption is what scientists call a coronal mass ejection (CME) — a type of sun storm that can fire off billions of tons of solar material at more than a million miles per hour, they added.

When aimed directly at Earth, the most powerful CME events can pose a risk to satellites and astronauts in orbit, as well as interfere with communications and navigation networks. They can even damage ground-based power infrastructure.

But the May Day solar eruption occurred on the side of the sun and was not aimed at Earth, NASA officials said.

It produced a dazzlingly bright wave of plasma that expanded from the sun's surface and then erupted from the sun's side, or limb, into open space.

The sun is currently in an active phase of its 11-year solar weather cycle and is expected to reach its peak activity this year.

Sunday, April 21, 2013

NASA SOHO STEREO Image: CME Plasma Loops and Arcs

Credit: SOHO

Loops and arcs shoot from two active regions on the sun, April 8, 2013. 

The STEREO's (Ahead) spacecraft took the image in extreme UV light. 

The loops consist of plasma at temperatures up to a million degrees C., arcing along the lines of magnetic fields.

Friday, January 4, 2013

NASA SDO Image: Solar Eruption

A solar eruption gracefully rose up from the sun on Dec. 31, 2012, twisting and turning. 

Magnetic forces drove the flow of plasma, but without sufficient force to overcome the sun’s gravity much of the plasma fell back into the sun.

The length of the eruption extends about 160,000 miles out from the Sun. 

With Earth about 7,900 miles in diameter, this relatively minor eruption is about 20 times the diameter of our planet.

› See video and relative size of Earth to eruption on 'Solar Ballet on the Sun' feature.

Image Credit: NASA/SDO

Wednesday, July 25, 2012

NASA SDO Images: Colourful Mapping of Sun's Plasma - YouTube


According to NASA it's pure science and not art, but when Nicholeen Viall, a solar scientist at NASA's Goddard Space Flight Center created a new data visualization technique, the resulting solar images were reminiscent of an impressionist's painting.

Using raw solar data from NASA's Solar Dynamics Observatory (SDO) and needing to represent it in a understandable manner, researchers often visualize the data through graphs and images. In the case of Viall's new technique, the result was not just informative but beautiful.

According to NASA, Viall wanted to look at SDO's in a different perspective. "SDO's Atmospheric Imaging Assembly (AIA), constructed for NASA by Lockheed Martin, provides images of the sun in 10 different wavelengths, each approximately corresponding to a single temperature of material.

Therefore, when one looks at the wavelength of 171 Angstroms, for example, one sees all the material in the sun's atmosphere that is a million degrees Kelvin.

By looking at an area of the sun in different wavelengths, one can get a sense of how different swaths of material change temperature.

If an area seems bright in a wavelength that shows a hotter temperature an hour before it becomes bright in a wavelength that shows a cooler temperature, one can gather information about how that region has changed over time."

The technique involved using 12 hours of data representing the history of cooling and heating at a particular spot on the sun.

Each colour pixel represents a moment in that 12 hour period. NASA says that the heat history holds clues to the mechanisms that drive the temperature and movements of the sun's atmosphere.

The images Viall's created show that over a 12-hour period the material appears to be cooling. For there to be cooling there must have been heating going in the process as well.

But Viall's images don't show the steady heating expected. The conclusion is that the heating happens so quickly that it doesn't show up in the images.

According to NASA this supports those theories that say nanobursts of energy help heat the corona.

Friday, January 20, 2012

SDO helps measure magnetic fields on the sun's surface

Science nuggets are a collection of early science results, new research techniques, and instrument updates that further our attempt to understand the sun and the dynamic space weather system that surrounds Earth.

A subset of data that helps map out the sun's magnetic fields was recently released from the Solar Dynamics Observatory (SDO).

Observations that measure the strength and direction of magnetic fields on the solar surface, known as vector magnetograms, play a crucial role in understanding how those fields change over time and trigger giant eruptions off the surface of the sun such as solar flares and coronal mass ejections (CMEs).

Collecting the information needed to make vector magnetograms is one of several tasks performed by SDO's Helioseismic and Magnetic Imager (HMI), an instrument led by a team at Stanford University.

HMI has been collecting data since May of 2010, providing scientific data on the strength of the sun's magnetic field and the sound waves moving around inside the Sun.

HMI relies on interpreting the way light is affected as it travels through the fields in order to measure them from afar.

For example, a phenomenon known as the Zeeman effect splits light into different wavelengths based on the magnetic field strength and, in addition, light may be polarized based on the magnetic field direction.

HMI uses these observations to produce vector magnetograms. Producing vector magnetograms at HMI’s high resolution, however, required developing new computer processing techniques to successfully interpret subtle details about the magnetic field.

Wednesday, November 16, 2011

Solar wind is rhombic-shaped

The plasma beta represents the ratio of kinetic to magnetic pressure in the cosmic plasma. 

The anisotropy is the ratio of the perpendicular and parallel temperatures to the magnetic field lines. 

The number of measured values is shown in colour (red corresponds to many values, blue to few values). 

Why the measurements take on the characteristic rhombic shape is explained by a new model by Bochum's physicists. Source: Physical Review Letters.

Why the temperatures in the solar wind are almost the same in certain directions, and why different energy densities are practically identical, was until now not clear.

With a new approach to calculating instability criteria for plasmas, Bochum researchers lead by Prof. Dr. Reinhard Schlickeiser (Chair for Theoretical Physics IV) have solved both problems at once. They were the first to incorporate the effects of collisions of the solar wind particles in their model.

This explains experimental data significantly better than previous calculations and can also be transferred to cosmic plasmas outside our solar system. The scientists report on their findings in Physical Review Letters.

Temperatures and pressures in the cosmic plasma
The solar wind consists of charged particles and is permeated by a magnetic field. In the analysis of this plasma, researchers investigate two types of pressure: the magnetic pressure describes the tendency of the magnetic field lines to repel each other, the kinetic pressure results from the momentum of the particles.

The ratio of kinetic to magnetic pressure is called plasma beta and is a measure of whether more energy per volume is stored in magnetic fields or in particle motion.

In many cosmic sources, the plasma beta is around the value one, which is the same as energy equipartition. Moreover, in cosmic plasmas near temperature isotropy prevails, i.e. the temperature parallel and perpendicular to the magnetic field lines of the plasma is the same.

Explaining satellite data
For over a decade, the instruments of the near-earth WIND satellite have gathered various solar wind data. When the plasma beta measured is plotted against the temperature anisotropy (the ratio of the perpendicular to the parallel temperature), the data points form a rhombic area around the value one.

"If the values move out of the rhombic configuration, the plasma is unstable and the temperature anisotropy and the plasma beta quickly return to the stable region within the rhombus" says Prof. Schlickeiser.

However, a specific, detailed explanation of this rhombic shape has, until now, been lacking, especially for low plasma beta.

Wednesday, November 9, 2011

ESA Venus Express: Earth’s twin planet?

Mars, Earth and Venus are immersed in a flow of plasma, an ionised and highly variable gas originating from the Sun, called the solar wind.

While Earth has a planetary magnetic field, which can deviate the flow of solar wind, Venus (and Mars) don’t.

Gases in the upper atmospheres of these planets are ionised and can thus interact with the solar wind.

Venus is as large as Earth and it is difficult for its atmosphere to escape due to the planet’s gravity.

The solar wind is the best source of energy to accelerate the upper atmosphere’s charged particles, giving them enough energy to escape. This is why Venus loses its atmosphere due to interaction with the solar wind.

To understand this phenomenon, the key questions that the instruments studying plasma on Venus Express must answer are: what and how much of the atmosphere is lost, and where is it lost?

Right now, solar activity is at its minimum in the 11-year cycle, making the solar wind weaker than average. The critical question now is how solar wind interacts with Venus when solar activity is low.

 The magnetometer (MAG) on board ESA’s Venus Express detected wave signals that show evidence of lightning in the atmosphere.

Credits: ESA (Animation by C. Carreau)

Tuesday, August 16, 2011

NASA's Zero-G carry Princeton University teachers: PPPL lets teachers hitch a ride

As part of a Princeton-sponsored team, Miller and Williams were flying at that moment on a NASA aircraft modified to simulate a reduced-gravity environment.

They were there to study how microgravity affected the movement of the pendulum, crafted from a softball, and the dynamics of the bubbles, all of which were contained in a clear plastic box.

Weightless Wonder Franko

PPPL team members Susan Franko of Gregory Elementary School in Trenton (left) and Patty Hillyer (center, in red T-shirt) of Matawan-Aberdeen Middle School in Cliffwood observe their experimental box on the zero-gravity flight.

The teachers had journeyed to NASA Johnson Space Center's Ellington Field in Houston to conduct experiments along with some 80 participants in NASA's Reduced Gravity Education Flight Program July 22-29.

The U.S. Department of Energy's Princeton Plasma Physics Laboratory (PPPL) sponsored six of the dozen teams, including one dubbed the "Space Cowboys" with Miller, Williams and four others. In total, PPPL sponsored about 40 participants, including teachers from various New Jersey school districts and researchers from the lab.

"Many of the teachers, for the first time, designed, built and performed an actual scientific experiment," said PPPL Science Education Program Head Andrew Zwicker, who rode the Zero-G aircraft twice with this year's K-12 educators. "They plan to use the experience, and the curricula they designed based upon their experiments, in their classrooms."

Princeton University - PPPL lets teachers hitch a ride on NASA's Zero-G

Friday, April 1, 2011

NASA PS-PVD: Plasma Spray-Physical Vapour Deposition

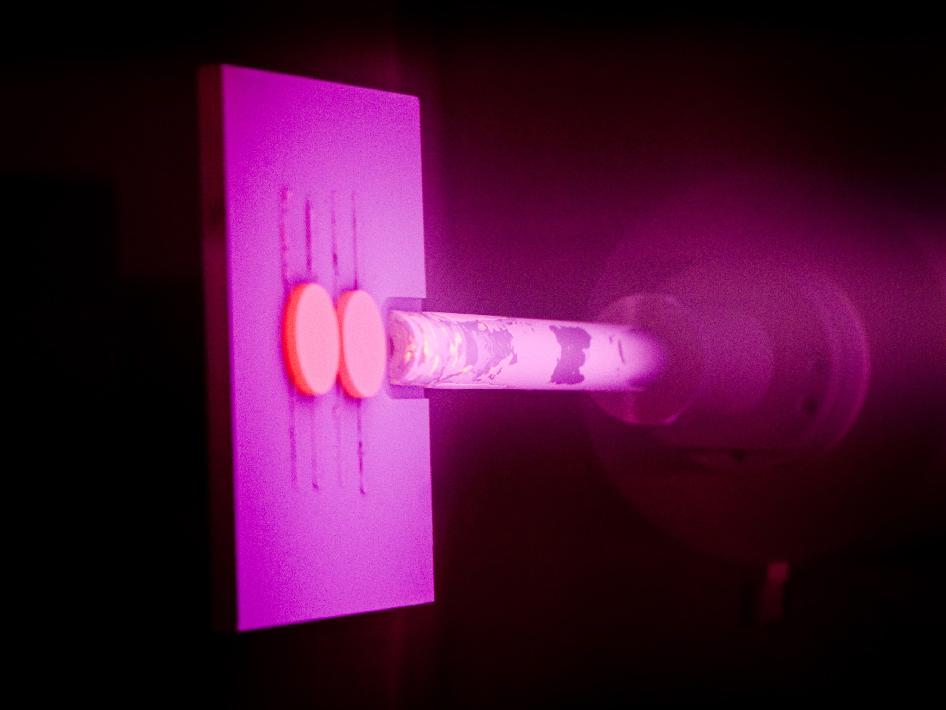
Inside the Plasma Spray-Physical Vapour Deposition, or PS-PVD, ceramic powder is introduced into the plasma flame, which vapourises it and then condenses it on the object, to form the ceramic coating.

The PS-PVD rig at NASA's Glenn Research Center uses new technology to create super thin ceramic coatings, which are being developed to protect high efficiency engines.

The coatings created in the PS-PVD rig are thinner and more complex than those previously available.

The PS-PVD rig uses a system of vacuum pumps and a blower to remove air from the chamber, reducing the pressure inside to fraction of normal atmospheric pressure. The plasma flame is extremely hot and reaches 10,000 degrees Celsius.

Ceramic powder is introduced from the torch into the plasma flame. The plasma vapourises the ceramic powder, which then condenses 5 feet away from the torch onto the component to form the ceramic coating.

Plasma, neither a gas, liquid or a solid, is the fourth state of matter and often behaves like a gas, except that it conducts electricity and is affected by magnetic fields. On an astronomical scale, plasma is very common.

The sun is composed of plasma, fire is plasma, fluorescent and neon lights contain small amounts of plasma. NASA’s PS-PVD rig is one of only two such facilities in the country and one of four in the world.

Image Credit: NASA/Marvin G. Smith (Wyle Information Systems LLC)

Wednesday, June 9, 2010

Severe Solar storm 93 million miles away, followed by death and destruction


• A 'perfect storm' of plasma and solar energy on a course to Earth at the speed of light could cause a global economic disaster. Picture: Getty

The sun, the scientists say, is awakening from a long and deep slumber and set to embark on a period of violent solar activity that could send devastating electromagnetic radiation racing to our planet.

One massive storm on the sun's surface, 93 million miles away, would be powerful enough to knock out power grids, destroy satellites controlling GPS and communications networks, ground airlines and throw the world's banking system into chaos.

The disruption to the fuel chain and subsequent breakdown in social order could leave governments powerless and tens of millions without clean water, access to medicines or fresh food, Nasa studies suggest.

If it sounds like the plot of Hollywood's latest apocalyptic movie, scientists are taking the threat seriously enough to have called government officials, disaster response managers, power company chiefs and other interested parties to a space weather forum in Washington DC yesterday.

"A storm of this magnitude would be a low probability event but would have a very high impact," said Chris St Cyr, a senior astrophysicist at Nasa's Goddard Space Flight Centre in Maryland.

"It might not happen as often as hurricanes, earthquakes or volcanic eruptions but we are more vulnerable than ever before. Now, we use satellites for mobile phones, navigation, communication, just running your Visa card through to make a purchase.

"Our power grids are interconnected and would act as one giant antenna in a big geomagnetic storm. There's a need to highlight to those in decision-making positions that this is a natural hazard that we didn't have to worry about in the 1970s, but now we do."

St Cyr's colleagues at Nasa's Heliophysics Science Division, which studies the sun's relationship with Earth and neighbouring planets, say solar activity runs in cycles averaging 11 years, with the next peak due in late 2012 into 2013.

"We have been in an extended phase of minimal activity, which typically lasts two to three years but this time has been more than four," St Cyr said.

As solar activity builds, an increase in sunspots, cooler areas on the surface caused by increased magnetic activity, leads to more eruptions known as solar flares that blast highly-charged particles of energy into the universe.

Wednesday, April 28, 2010

SDO Observes Massive Eruption And Scorching Coronal Rain

SDO Observes Massive Eruption And Scorching Rain

Just last week, scientists working with NASA's new Solar Dynamics Observatory (SDO) released the most astonishing movies of the sun anyone had ever seen. Now, they're doing it again.

"SDO has just observed a massive eruption on the sun-one of the biggest in years," says Lika Guhathakurta of NASA headquarters in Washington DC. "The footage is not only dramatic, but also could solve a longstanding mystery of solar physics."

Karel Schrijver of Lockheed Martin's Solar and Astrophysics Lab is leading the analysis. "We can see a billion tons of magnetized plasma blasting into space while debris from the explosion falls back onto the sun surface. These may be our best data yet."

The movie, recorded on April 19th, spans four hours of actual time and more than 100,000 km of linear space. "It's huge," says Schrijver. Indeed, the entire planet Earth could fit between the plasma streamers with room to spare.

Astronomers have seen eruptions like this before, but rarely so large and never in such fluid detail. As science team member Alan Title of Lockheed Martin pointed out at last week's press conference, "no other telescope comes close to the combined spatial, temporal and spectral resolution of SDO."

Schrijver says his favorite part of the movie is the coronal rain. "Blobs of plasma are falling back to the surface of the sun, making bright splashes where they hit," he explains. "This is a phenomenon I've been studying for years."

Coronal rain has long been a mystery. It's not surprising that plasma should fall back to the sun. After all, the sun's gravity is powerful. The puzzle of coronal rain is how slowly it seems to fall. "The sun's gravity should be pulling the material down much faster than it actually moves. What's slowing the descent?" he wonders.

For the first time, SDO provides an answer.

"The rain appears to be buoyed by a 'cushion' of hot gas," says Schrijver. "Previous observatories couldn't see it, but it is there."

One of SDO's game-changing capabilities is temperature sensing. Using an array of ultraviolet telescopes called the Atmospheric Imaging Assembly (AIA), the observatory can remotely measure the temperature of gas in the sun's atmosphere. Coronal rain turns out to be relatively cool-"only" 60,000 K. When the rains falls, it is supported, in part, by an underlying cushion of much hotter material, between 1,000,000 and 2,200,000 K.

The movie is available here

Tuesday, March 9, 2010

New NASA Rocket Engine Could Reach Mars in 40 Days


An early concept painting of the VASIMR ISS payload mounted on the International Space Station. Credit: NASA

Future Mars outposts or colonies may seem more distant than ever with NASA's exploration plans in flux, but the rocket technology that could someday propel a human mission to the red planet in as little as 40 days may already exist.

A company founded by former NASA astronaut Franklin Chang-Diaz has been developing a new rocket engine that draws upon electric power and magnetic fields to channel superheated plasma out the back. That stream of plasma generates steady, efficient thrust that uses low amounts of propellant and builds up speed over time.

"People have known for a long time, even back in the '50s, that electric propulsion would be needed for serious exploration of Mars," said Tim Glover, director of development at the Ad Astra Rocket Company.

The rocket technology could drastically cut down the amount of time a spacecraft needs to send astronauts on Mars missions. Instead of half a year, a spacecraft could make the trip in just over a month using the engine and a large enough power source, according to an Ad Astra mission study.

NASA's recent course change has freed up some funding for new propulsion technologies. And the U.S. space agency has not lost sight of the red planet, NASA administrator Charles Bolden told Congress as he presented a new budget last month.

"While we cannot provide a date certain for the first human visit, with Mars as a key long-term destination we can identify missing capabilities needed for such a mission and use this to help define many of the goals for our emerging technology development," Bolden said.

Familiar chemical rockets that burn solid or liquid chemical propellants won't get humans to Mars fast because they would require too much propellant. They can create a huge boost for several minutes at the cost of huge inefficiency — not unlike a speed demon with poor gas mileage.

Wednesday, April 22, 2009

Sigmoids - not so Freudian

This dramatic

This dramatic "sigmoid", an "S"-shaped bundle of plasma, appeared on the surface of the sun in 2007 and later erupted. Now a new model has reproduced the event (Image: NASA/STFC/ISAS/JAXA)

The formation and eruption of large "S"-shaped structures on the surface of the sun have been modelled in the best detail yet. Further refinements of the model might help sun-watchers predict severe space storms days in advance.

'Sigmoids' are S-shaped structures that appear intermittently on the sun's surface. Many produce eruptions of hot ionised gas, or plasma, such as coronal mass ejections and flares. If the eruptions are powerful enough, they can zap satellites, endanger astronauts, and knock out power grids (see Space storm alert: 90 seconds from catastropheMovie Camera).

Until now, models of the structures have not been able to reproduce the full lifetime of a sigmoid from its beginnings within the sun to its eventual eruption sometimes days later. But now researchers say they have come up with a simple model that could do just that.

"For the first time, we have built a three-dimensional model that shows in a very nice and self-consistent way the evolution and final eruption of a sigmoid," says Vasilis Archontis of St Andrews University in Scotland.