Showing posts with label Environmental. Show all posts

Thursday, May 2, 2013

NOAA GOES-R Satellite: Instrument package to assess space weather ready for delivery

A multimillion dollar University of Colorado Boulder instrument package to study space weather has passed its pre-installation testing and is ready to be incorporated onto a National Oceanic and Atmospheric Administration (NOAA) satellite for a 2015 launch.

Designed and built by CU's Laboratory for Atmospheric and Space Physics, the instrument suite known as the Extreme Ultraviolet and X-ray Irradiance Sensors (EXIS), is the first of four identical packages that will fly on four NOAA weather satellites slated for launch beginning in 2015.

EXIS consists of an Extreme Ultraviolet Sensor (EUVS), an X-Ray sensor (XRS) and a combined EUVS/XRS electronics box (EXEB) to control subsystems and to do command and data handling interface with the GOES-R spacecraft. (Courtesy LASP)

CU-Boulder's EXIS will measure energy output from the sun that can affect satellite operations, telecommunications, GPS navigation and power grids on Earth as part of NOAA's next generation Geostationary Operational Environmental Satellites (GOES-R).

NASA issued the contract with CU-Boulder on behalf of NOAA to design, build, test, deliver and scientifically support the four instrument packages for roughly $95 million, said LASP Senior Research Scientist Frank Eparvier, principal investigator on the project.

The EXIS instrument package will be delivered to Lockheed Martin Space Systems Co. in Littleton, Colo., for installation on the spacecraft in the coming months.

"We are excited because we developed and built all new technology for the EXIS instrument package for the GOES-R satellite," said Eparvier.

"We already have a close working relationship with NOAA's Space Weather Prediction Center in Boulder, and these extremely sensitive instruments should help scientists better understand solar events and help to mitigate the effects of space weather on Earth."

EXIS consists of two LASP instruments, including XRS, an X-ray sensor that can determine the strength of solar flares and provide rapid alerts to scientists, said Eparvier.

Large solar flares, equivalent to the explosion of millions of atomic bombs, can trigger "proton events" that send charged atomic particles flying off the sun and into Earth's atmosphere in just minutes.

They can damage satellites, trigger radio blackouts and even threaten the health of astronauts by penetrating spacecraft shielding, he said.

Thursday, February 28, 2013

NASA's Aquarius Sees Salty Shifts

NASA¹s Aquarius instrument has been orbiting the Earth for a year, measuring changes in salinity, or salt concentration, in the surface of the oceans. 

The Aquarius team released last September this first global map of ocean saltiness, a composite of the first two and a half weeks of data since the instrument became operational on August 25. 

Credit: NASA/GSFC/JPL-Caltech

Colourful new images chronicle the seasonal stirrings of our salty world: Pulses of freshwater gush from the Amazon River's mouth; an invisible seam divides the salty Arabian Sea from the fresher waters of the Bay of Bengal; a large patch of freshwater appears in the eastern tropical Pacific in the winter.

These and other changes in ocean salinity patterns are revealed by the first full year of surface salinity data captured by NASA's Aquarius instrument. 

"With a bit more than a year of data, we are seeing some surprising patterns, especially in the tropics," said Aquarius Principal Investigator Gary Lagerloef, of Earth & Space Research in Seattle. "We see features evolve rapidly over time." 


Launched June 10, 2011, aboard the Argentine spacecraft Aquarius/Satélite de Aplicaciones Científicas (SAC)-D, Aquarius is NASA's first satellite instrument specifically built to study the salt content of ocean surface waters. 


Salinity variations, one of the main drivers of ocean circulation, are closely connected with the cycling of freshwater around the planet and provide scientists with valuable information on how the changing global climate is altering global rainfall patterns. 

The salinity sensor detects the microwave emissivity of the top 1 to 2 centimeters (about an inch) of ocean water -- a physical property that varies depending on temperature and saltiness. 


The instrument collects data in 386 kilometer-wide (240-mile) swaths in an orbit designed to obtain a complete survey of global salinity of ice-free oceans every seven days. 

The Changing Ocean
The animated version of Aquarius' first year of data unveils a world of varying salinity patterns. The Arabian Sea, nestled up against the dry Middle East, appears much saltier than the neighboring Bay of Bengal, which gets showered by intense monsoon rains and receives freshwater discharges from the Ganges and other large rivers. 


Another mighty river, the Amazon, releases a large freshwater plume that heads east toward Africa or bends up north to the Caribbean, depending on the prevailing seasonal currents. 

Pools of freshwater carried by ocean currents from the central Pacific Ocean's regions of heavy rainfall pile up next to Panama's coast, while the Mediterranean Sea sticks out in the Aquarius maps as a very salty sea. 

One of the features that stand out most clearly is a large patch of highly saline water across the North Atlantic. This area, the saltiest anywhere in the open ocean, is analogous to deserts on land, where little rainfall and a lot of evaporation occur. 


A NASA-funded expedition, the Salinity Processes in the Upper Ocean Regional Study (SPURS), traveled to the North Atlantic's saltiest spot last fall to analyze the causes behind this high salt concentration and to validate Aquarius measurements.


"My conclusion after five weeks out at sea and analyzing five weekly maps of salinity from Aquarius while we were there was that indeed, the patterns of salinity variation seen from Aquarius and by the ship were similar," said Eric Lindstrom, NASA's physical oceanography program scientist, of NASA Headquarters, Washington, and a participant of the SPURS research cruise.


NASA Goddard Space Centre

Wednesday, October 17, 2012

NASA Jupiter Images: Turmoil From Below, Battering From Above

Images in the visible-light and infrared parts of the spectrum highlight the massive changes roiling the atmosphere of Jupiter.

Image credit: NASA/IRTF/JPL-Caltech/NAOJ/A. Wesley/A. Kazemoto/C. Go

Jupiter, the mythical god of sky and thunder, would certainly be pleased at all the changes afoot at his namesake planet.

As the planet gets peppered continually with small space rocks, wide belts of the atmosphere are changing colour, hotspots are vanishing and reappearing, and clouds are gathering over one part of Jupiter, while dissipating over another.

The results were presented today by Glenn Orton, a senior research scientist at NASA's Jet Propulsion Laboratory, Pasadena, Calif., at the American Astronomical Society's Division for Planetary Sciences Meeting in Reno, Nev.

"The changes we're seeing in Jupiter are global in scale," Orton said. "We've seen some of these before, but never with modern instrumentation to clue us in on what's going on."

"Other changes haven't been seen in decades, and some regions have never been in the state they're appearing in now."

"At the same time, we've never seen so many things striking Jupiter. Right now, we're trying to figure out why this is all happening."

The Jupiter team have been taking images and maps of Jupiter at infrared wavelengths from 2009 to 2012 and comparing them with high-quality visible images from the increasingly active amateur astronomy community.

Read the full article here

NASA - Jupiter Shakes it off

Jupiter has been suffering more impacts over the last four years than ever previously observed, including this meteoroid impact on Sept. 10, 2012.

The left-hand image was taken from a red-filtered video by amateur astronomer George Hall of Dallas, Texas, on Sept. 10 and processed by Ricardo Hueso (University of the Basque Country, Bilbao, Spain).

The right-hand image is an infrared image from NASA’s Infrared Telescope Facility on Mauna Kea, Hawaii, taken on Sept. 11.

Scientists compare the visible-light images to the infrared images to learn about the fireball's disruption of the Jovian atmosphere.

In this case, the infrared view reveals no long-term disturbance. The circles in the annotated version indicate where the impact occurred.

Scientists think the fireball was caused by an object less than 45 feet (15 meters) in diameter.

Image credit: NASA/IRTF/JPL-Caltech/G. Hall/University of the Basque Country

Thursday, September 6, 2012

NOAA Environmental Visualization Laboratory: Hurricane Michael Reaches Category 3

With maximum sustained winds of 115 mph, Hurricane Michael is the first Atlantic storm of the 2012 season to reach Category 3 intensity.

The storm is shown here in high resolution infrared imagery from the NOAA/NASA Suomi NPP satellite taken on September 6, 2012 at 04:22z. 


Hurricane Michael swelled to the first category three storm of 2012 early Thursday as it churned far from land in the middle of the Atlantic, the Miami-based National Hurricane Center (NHC) said.

As of 0900 GMT the hurricane was packing winds of up to 115 miles (185 kilometers) per hour as it swirled more than 1,000 miles southwest of the Azores archipelago, the forecasters said.

There were no coastal watches or warnings in effect, and the NHC said Michael may begin gradually weakening by Friday.

Hurricane Leslie, a category one storm cycling closer to North America, continued moving northward and was projected to pass over or near Bermuda on Sunday, but no warnings or watches have been issued, the NHC said.

Monday, April 30, 2012

NASA James Webb Space Telescope: Testing in Space Environment Simulator

Several critical items related to NASA's next-generation James Webb Space Telescope currently are being tested in the thermal vacuum test chamber at NASA's Goddard Space Flight Center, Greenbelt, Md.

This image shows the Optical Telescope Element Simulator, or OSIM, wrapped in a silver blanket on a platform, being lowered into the Space Environment Simulator vacuum chamber via crane to be tested to withstand the cold temperatures of space.

Image Credit: NASA/Chris Gunn

Friday, April 20, 2012

NASA - Ash Plume from Popocatepetl Volcano

NASA satellites have been keeping watch on the ash and smoke coming from the Popocatepetl volcano in Mexico. "Popocatepetl" is the Aztec word for "smoking mountain."

NASA's Aqua satellite flew over Mexico's Popocatepetl volcano on April 16, 2012 at 20:15 UTC (4:15 p.m. EDT) and captured this visible image of its plume of smoke and ash.

The image was taken by the Moderate Resolution Imaging Spectroradiometer (MODIS) instrument that flies onboard the Aqua satellite. MODIS also flies on NASA's Terra satellite.

According to the U.S. Geological Survey (USGS), on April 16, the volcano's gas and ash plume reached a height of about 1.2 miles (2 kilometers), spreading ash in the nearby town of Puebla. Mexico's National Center for Prevention of Disasters (CENAPRED) increased the Alert Level at the volcano to Yellow Phase Three. On April 16-17 the gas-and-steam emissions were reported as being constant.

Popocatepetl is located about 34 miles (55 kilometers east of Mexico City. More than 30 million people live within sight of the volcano. The last significant eruption was recorded from 1920-1922, and minor ash clouds were reported in 1923-24, 1933, 1942-43, and 1947, according to USGS. The most recent activity occurred on December 21, 1994 when ash from the volcano dusted the city of Puebla, east of the volcano's summit.

Image credit: NASA/Goddard/MODIS Rapid Response Team

Thursday, April 12, 2012

ESA Envisat services interrupted

Envisat’s Medium Resolution Imaging Spectrometer (MERIS) captured this image on 8 April 2012 at 13:05 CEST. 

The image was transmitted in Ka-band to ESA/ESRIN though direct transmission via Artemis, the ESA Data Relay satellite.

The image, which is of nominal quality, shows Portugal and Spain. 


It is the last Envisat data transmitted via Ka-band before the communication anomaly affected the Envisat satellite.

Credits: ESA

After 10 years of service, Envisat has stopped sending data to Earth. ESA’s mission control is working to re-establish contact with the satellite.

Although this landmark mission has been in orbit twice as long as it was designed for, ESA hopes to keep the satellite in service until the launch of the successor Sentinel missions.

The first sign that there was a problem came on 8 April when contact with the satellite was unexpectedly lost, preventing the reception of any data as it passed over the Kiruna ground station in Sweden.

ESA’s mission control team declared a spacecraft emergency and immediately called for support from additional ESA tracking stations around the world. A team of operations and flight dynamics specialists and engineers was quickly assembled.

In a concerted effort, the recovery team, which included experts from industry, spent the next days trying to re-establish communications with the satellite.

While it is known that Envisat remains in a stable orbit around Earth, efforts to resume contact with the satellite have, so far, not been successful.

As is standard practice, an anomaly review board is investigating the cause for the break in communications.

Envisat has exceeded its planned life of five years by far. Since it was launched in 2002, this remarkable satellite has orbited Earth more than 50 000 times delivering thousands of images and a wealth of data to study and understand our changing planet, establishing itself as a landmark success in observing Earth from space.

As the world’s most complex Earth observation satellite, Envisat carries 10 sophisticated instruments that have provided key information about our land, oceans, ice and atmosphere. Combined with data from the ERS missions since 1991, Envisat has provided precise measurements on climate change over the last 20 years.

More than 4000 projects in over 70 countries have been supported with Envisat data. Data in the archives will continue to be available for users.

A contingency agreement with the Canadian Space Agency on Radarsat will be activated to allow a continuity in service. This will allow contracts to be served to some of the user requirements, if the problem with Envisat persists.

Wednesday, April 4, 2012

ESA Arianespace's Starsem affiliate readies the launch

Credits: ESA 

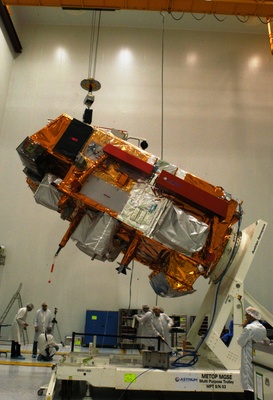
MetOp-B being readied for testing after arriving at the launch facilities at Baikonur.

ESA's MetOp-B is readied in Starsem’s facilities at Baikonur Cosmodrome, where the weather satellite will be orbited in May by a Soyuz launcher.

Preparations for the 25th mission of Arianespace’s Starsem affiliate are on schedule for a liftoff in the second half of May, using a Soyuz 2 launcher to orbit the European MetOp-B weather satellite from Kazakhstan’s Baikonur Cosmodrome.

With MetOp-B undergoing checkout since being delivered on March 6 to the cosmodrome, the launcher campaign has moved into a new phase with today’s arrival of the Soyuz vehicle’s Fregat M upper stage.

MetOp-B was developed as a joint undertaking between the European Space Agency and EUMETSAT (the European Organisation for the Exploitation of Meteorological Satellites).

It is the second of three nearly identical satellites to provide continuous weather observations until 2020, and follows MetOp-A – which was orbited by Starsem in October 2006 on a Soyuz mission from Baikonur Cosmodrome.

This upcoming flight uses a modernized Soyuz version of the workhorse Russian-built launcher, which also is in service with Arianespace at the Spaceport in French Guiana.

Starsem is Arianespace’s affiliate company created to operate commercial Soyuz missions from Baikonur Cosmodrome.

Its first launch was in February 1999, and the 24 flights performed to date have orbited a diverse range of payloads, including first- and second-generation satellites for Globalstar’s mobile voice and data services, the Cluster II and Corot scientific spacecraft, the Mars Express and Venus Express interplanetary probes, the Galaxy 14 and Amos 2 telecommunications platform, the GIOVE navigation satellite, an Inflatable Reentry and Descent Technology demonstrator, the Radarsat-2 Earth observation satellite, and MetOp-A.

Wednesday, March 28, 2012

ESA ENVISAT Image: Bali, Lombok, and Sumbawa: Where Worlds Collide

This image from the Envisat satellite is dominated by the Indonesian islands of Bali, Lombok and Sumbawa.

All three are part of the volcanic Sunda Arc along the submarine Java trench, where two tectonic plates are moving towards one another, and one slides under the other.

This tectonic deformation along the Java trench caused the 2004 Indian Ocean earthquake and subsequent tsunami.

To the west is Bali, one of Indonesia's main tourist destinations. The island's central mountains include peaks that reach over 3000 m, including an active volcano visible on the right side of the island.

Strong reflections of the radar signal used to produce this image appear like specks of light. They are mainly detectable in the southern part of the island, and are particularly concentrated around the provincial capital city of Denpasar.

This is the typical appearance of built-up areas in radar images, owing to the multiple reflection of the radar beam by buildings and especially metal constructions.

In the centre of the image is Lombok. Similar to Bali, we can see multiple reflections concentrated around the city of Mataram.

Varying colours stretch across the island's lowlands, which are highly cultivated, depicting changes in the land.

Sumbawa island lies to the east, dominated by mountainous terrain. This is also home to Mount Tambora, an active volcano.

In 1815, its massive eruption caused heavy ash falls that ruined local agriculture and even affected much of the Northern Hemisphere.

The deaths of over 70 000 people are attributed to this event. This image is a compilation of three passes by Envisat's radar on 20 June, 19 August and 17 December 2011.

Each is assigned a colour (red, green and blue) and combined to produce this representation. The colours reveal changes in the surface between Envisat's passes.

NASA Aqua MODIS: Science and Beauty Video


Beautiful images from the MODIS instrument on NASA's Aqua and Terra satellites are used by people all over the world every day but MODIS is about more than just pretty pictures.

The instrument's contributions to science include a better understanding of the Earth's cloud cover, aerosols, phytoplankton levels, and land cover.

Friday, March 2, 2012

ESA Envisat: Earth from Space: Historical view

West Africa’s coast along the Atlantic Ocean is pictured in this first image from Envisat’s MERIS instrument nearly a decade ago.

This week, Envisat celebrated ten years in orbit. The Medium Resolution Imaging Spectrometer (MERIS) on board the satellite was developed to measure sea colour in oceans and coastal areas, although it has been used for a variety of additional applications over the years.


Envisat carries ten sensors, collecting imagery and other data on Earth’s land, oceans, atmosphere, temperature and ice cover.

The first batch of data from the satellite in March 2002 was acquired via the Kiruna station in Sweden and processed at ESA’s ESRIN establishment in Italy and other centres throughout Europe.

In this first image from MERIS on 22 March 2002, a very dry desert directly borders the ocean teeming with life. To the south, a high concentration of phytoplankton was detected along the coasts of Senegal, the Gambia and Guinea-Bissau.

Small, single-celled phytoplankton play a key role in the marine food chain. They convert sunlight, carbon dioxide and nutrients into carbohydrates on which nearly all life in the ocean depends.

In most parts of Earth’s oceans, phytoplankton concentration is extremely low. However, in ‘upwelling areas’ like the one pictured here, the ocean becomes rich in minerals from the mixing of surface waters with deeper waters.

The most important fishing grounds can be found in these upwelling areas. Climate change has an effect on the intensity and geographical position of these areas, which, in turn, has important consequences for the fishing industries and those who depend on them.

Also evident in this image is the transition from the dry desert lands in the north through the savannah and to tropical vegetation in the south, which receives more rainfall. MERIS can monitor land use that leads to increased erosion and soil loss.

The Image of the Week is featured on ESA Web-TV, broadcast online every Friday at 10:00 CET.

Thursday, February 9, 2012

NASA GRACE: Global Warming Melts Billions of Tons of Ice Annually (VIDEO)


Researchers from NASA and the University of Colorado Boulder have discovered that glaciers and ice caps are shedding 150 billion tons of ice annually because of global warming. They discovered this using Gravity Recovery and Climate Experiment (GRACE) satellites.

The researchers measured ice loss percentages across all of Earth's ice reserves between 2003 and 2010, with particular emphasis on glaciers and ice caps outside of Greenland and Antarctica.

They discovered that these geological formations were shedding roughly 150 billion tons of ice annually. The most alarming conclusion was that ice caps and glaciers from within Greenland and Antarctica were shedding 385 billion tons (100 cubic miles) of ice every year.

Credit: NASA/JPL-Caltech/University of Colorado 

Average changes in ice thickness in centimeters per year from 2003 to 2010, as measured by NASA’s Grace satellites, in each of the world’s ice caps and glacier systems outside of Greenland and Antarctica. Blue represents ice mass loss, while red represents ice mass gain.

The study also suggested that mountains on the Asian continent - the Himalayas, the Pamir and the Tien Shan - were shedding approximately 4 billion tons of ice annually.

As strange as it may sound, this figure actually comes as a relief. Earlier ground-based estimates suggested ice loss in high Asian mountains may range up to 50 billion tons, annually.

The total ice loss from Greenland, Antarctica and all of Earth's glaciers and ice caps from 2003 to 2010 was about 4.3 trillion tons (1,000 cubic miles) which is about eight times the water volume of Lake Erie in the U.S.

These measurements were made with the NASA-developed GRACE satellite. GRACE was launched in 2002 and is a twin satellite that measure changes in the Earth's gravity field, as caused by regional changes in the planet's mass, including ice sheets, oceans and water stored in the soil and in underground aquifers.

"Earth is losing a huge amount of ice to the ocean annually, and these new results will help us answer important questions in terms of both sea rise and how the planet's cold regions are responding to global change," said John Wahr, a Professor at the University of Colorado Boulder.

"One possible explanation is that previous estimates were based on measurements taken primarily from some of the lower, more accessible glaciers in Asia and extrapolated to infer the behaviour of higher glaciers. But unlike the lower glaciers, most of the high glaciers are located in very cold environments and require greater amounts of atmospheric warming before local temperatures rise enough to cause significant melting. This makes it difficult to use low-elevation, ground-based measurements to estimate results from the entire system," he added.

"This study finds that the world's small glaciers and ice caps in places like Alaska, South America and the Himalayas contribute about .02 inches per year to sea level rise," said Tom Wagner, a program scientist at NASA Headquarters in Washington, "While this is lower than previous estimates, it confirms that ice is being lost from around the globe, with just a few areas in precarious balance. The results sharpen our view of land ice melting, which poses the biggest, most threatening factor in future sea level rise."

Monday, February 6, 2012

ESA CryoSat breaks the ice with ocean currents

Click on the image to visit ESA Portal and view the animation.

Animation of the intensity of ocean surface currents as predicted by MyOcean’s global ocean model (1/12°) after assimilation of altimetry data. 

In addition to major currents such as the Gulf Stream, the turbulence driving the ocean circulation is visible. 

The blue-to-white colour scale represents surface currents in metres per second.

Credits: MyOcean/Mercator-Ocean

Ocean measurements from ESA’s CryoSat mission are being exploited by the French space agency CNES to provide global ocean observation products in near-real time. Understanding sea-surface currents is important for marine industries and protecting ocean environments.

As it orbits from pole to pole, CryoSat’s main objective is to measure the thickness of polar sea ice and monitor changes in the ice sheets that blanket Greenland and Antarctica. But the satellite also features an innovative radar altimeter that not only detects tiny variations in the height of the ice, but can also measure sea level and the height of the waves.

Starting today , CryoSat ocean measurements are being processed by CNES and distributed to the oceanography community. These products will be assimilated using models from the MyOcean project in near-real time to enhance sea surface products and to improve the quality of the model forecasts.

Monday, January 23, 2012

ESA ENVISAT & ERS Satellites detect abundance of fresh water in the Arctic

ESA satellites show that a large dome of fresh water has been building up in the Arctic Ocean over the last 15 years.

A change in wind direction could cause the water to spill into the north Atlantic, cooling Europe.

The results are remarkable: since 2002, the sea surface in the studied area has risen by about 15 cm, and the volume of fresh water has increased by some 8000 cubic km – around 10% of all the fresh water in the Arctic Ocean.

Researchers from the Centre for Polar Observation and Modelling (CPOM) at University College London and the UK’s National Oceanography Centre used data from ESA’s ERS-2 and Envisat satellites to measure sea-surface height over the western Arctic from 1995 to 2010.

The results were published yesterday in the online version of the scientific journal, Nature Geoscience.


Mean sea surface
The scientists conclude that the dome could be a result of strong Arctic winds accelerating a large ocean circulation known as the Beaufort Gyre, causing the sea surface to bulge.

A change in the direction of the wind would cause the fresh water to spill into the rest of the Arctic Ocean and even reach the north Atlantic.

This could slow a key ocean current, stemming from the Gulf Stream, and subsequently cool Europe.

This current keeps the continent relatively mild compared to other areas at similar latitudes.

“When we looked at our data on a year-to-year basis, we noticed that the changes in the sea surface height did not always follow what the wind was doing, so we thought about reasons why this might happen,” said Katharine Giles, CPOM research fellow and lead author of the study.

“One idea is that sea ice forms a barrier between the atmosphere and the ocean. So as the sea ice cover changes, the effect of the wind on the ocean might also change.

“Our next step is to look into how changes in the sea ice cover might affect the coupling between the atmosphere and the ocean in more detail to see if we can confirm this idea.”

Sea ice can be measured by different types of satellite data. Radar altimeters on satellites such as the two used in the study, Envisat and ERS-2, can be particularly useful when observing inaccessible areas like the Arctic.

Friday, January 13, 2012

ESA ENVISAT: A southern summer bloom

In this ESA Envisat image, a phytoplankton bloom swirls a figure-of-8 in the South Atlantic Ocean about 600 km east of the Falkland Islands.

During this period in the southern hemisphere, the ocean becomes rich in minerals from the mixing of surface waters with deeper waters.

Phytoplankton depend on these minerals, making blooms like this common in the spring and summer.

These microscopic organisms are the base of the marine food chain, and play a huge role in the removal of carbon dioxide from the atmosphere and the production of oxygen in the oceans.

By helping to regulate the carbon cycle, phytoplankton are important to the global climate system.

Different types and quantities of phytoplankton exhibit different colours, such as the blues and greens in this image.

Earth-observing satellites like Envisat can monitor these algal blooms. Once a bloom begins, an ocean colour sensor can make an initial identification of its chlorophyll pigment, and therefore its species and toxicity.

Since the phytoplankton are sensitive to environmental changes, it is important to monitor and model them for climate change calculations and to identify potentially harmful blooms.

Envisat’s MERIS instrument acquired this image on 2 December 2011 at a resolution of 300 m.

Wednesday, December 28, 2011

ESA ENVISAT Image: Arid Arabia

This Envisat image, acquired on 28 October 2011, shows central Saudi Arabia on the arid Arabian Peninsula. 

The area pictured is on the central plateau, Nejd, which slopes downwards from west to east. 

The dark circle near the centre of the image is the capital city of Riyadh, the nation’s legislative, financial administrative, diplomatic and commercial hub.

Credits: ESA

Thursday, December 22, 2011

ESA CryoSat ice satellite rides new waves

Estimate of wind speed over oceans using data from ESA’s CryoSat mission from 17 November – 13 December. The product was generated by NOAA using CryoSat’s fast delivery mode radar echoes.

Credits: NOAA – E. Leuliette

ESA's ice mission CryoSat in orbit. CryoSat is Europe's first mission dedicated to monitoring ice. 

By measuring the changes in the thickness of ice, both marine ice floating in the oceans and the vast ice sheets on land, the CryoSat mission will lead to a better understanding of how Earth's ice fields are responding to climate change.

Credits: ESA - AOES Medialab

ESA’s CryoSat mission has been gathering detailed information on the thickness of Earth’s ice since its launch in 2010. Through international collaboration, this state-of-the-art mission is soon to be used to monitor conditions at sea for marine forecasting.

CryoSat was built to measure tiny variations in the thickness of Earth’s ice. As a result, the mission is providing scientists with the data they need to help improve our understanding of the relationship between ice, climate and sea level.

As CryoSat orbits from pole to pole, it passes over vast expanses of ocean. So while the mission was designed specifically for ice monitoring, it can also serve to help improve the safety of marine traffic.

Sea level off the southeast coast of Australia on 15 December 2011 by combining CryoSat data with Envisat, Jason 1 and Jason 2.

Credits: CSIRO - D. Griffen

The satellite carries Europe’s first radar altimeter specialised for the purpose of detecting tiny variations in the height of the ice – but it can also be used to measure sea level and the height of the waves.

The instrument sends out short radar pulses and measures the time it takes for the signals to travel from the satellite to the ground and back. This information provides the height of the surface below.

The advantage of yielding this kind of information from CryoSat is also down to the advanced performance of its main SIRAL instrument.

When data from CryoSat are merged with other altimeter data such as that from the Envisat and Jason satellites, the combined estimation of wave height and wind speed is greatly improved.

In addition, thanks to its drifting orbit, CryoSat allows a high number of crossovers with other altimeter missions. This provides a set of measurements that have not been available before.

Tuesday, December 20, 2011

NASA Terra Aqua MODIS images: Volcano Kizimen Spews Fresh Ash Clouds


Kizimen, an isolated stratovolcano on Russia’s Kamchatka Peninsula, spewed ash nearly 10 kilometers (32,800 feet) into the air in mid-December 2011.

Seismic activity and thermal anomalies increased near the volcano in early December, culminating in a fresh eruption starting on December 13. Kizimen has been erupting sporadically since 2009.

The Moderate Resolution Imaging Spectroradiometer (MODIS) instruments on NASA’s Terra and Aqua satellites captured these natural-color images on December 14, 2011.

Terra passed over far eastern Russia first, at 11:05 a.m. local time, with Aqua following one hour and 50 minutes later. The time difference afforded a view of the movement of the ash plume as it blew to the south and east.

Observers with the Kamchatkan Volcanic Eruption Response Team detected lava flows and pyroclastic flows (hot avalanches of rock, ash, and water debris) on the eastern and northeastern flanks.

According to scientists at the Russian Academy of Sciences, air temperatures were 32 degrees Centigrade near the summit, while air temperatures in the surrounding region were –26 degrees.

Itar-Tass reported potential disruptions to air traffic in the northwest Pacific, particularly for low-flying planes, as aviators were put on the highest (red) alert for ash and debris.

The small abrasive particles in volcanic ash can get lodged in jet engines, causing engine failures. There was no threat, however, to local populations on the ground because of the remote location of Kizimen.
  1. References

  2. Itar-Tass News Agency (2011, December 14) Kamchatka’s Kizimen volcano erupting ash columns to height of more than 7 km. Accessed December 16, 2011.
  3. Kamchatkan Volcanic Eruption Response Team (2011, December 16) KVERT Information Releases. Accessed December 16, 2011.
  4. Smithsonian/U.S. Geological Survey Global Volcanism Program (n.d.) Kizimen. Accessed December 16, 2011.
  5. Smithsonian/U.S. Geological Survey Global Volcanism Program (2011, December 13) Weekly Volcanic Activity Report. Accessed December 16, 2011.
  6. Voice of Russia (2011, December 15) Kizimen volcano spewing ashes. Accessed December 16, 2011.
NASA image by Jeff Schmaltz, LANCE/EOSDIS MODIS Rapid Response. Caption by Michael Carlowicz.

Sunday, December 18, 2011

ESA and Soyuz launches sharp-eyed Pleiades satellite


A Russian Soyuz rocket has launched from French Guiana - only the second such vehicle to fly out of the territory's new Sinnamary spaceport.

The Soyuz put six satellites in orbit, including France's new Pleiades-1 high-resolution imaging spacecraft.

This satellite is designed to take pictures that resolve features on the ground as small as 50cm across.

The capability will put it on a par with the leading US commercial systems operated by GeoEye and DigitalGlobe.

Lift-off occurred on schedule at 23:03 local time, Friday (02:03 GMT, Saturday), with Pleiades-1 being dropped off in its 700km-high polar orbit some 55 minutes later.

The 970kg satellite is the result of a near-decade-long programme in the French space agency (Cnes) to develop one of the most powerful Earth observation systems in the world.

The spacecraft's sensor actually has a resolution of 70cm, but image processing will recover detail that is around the half-metre mark.

Pleiades-1
Pleiades-1 will be followed by Pleiades-2 in the coming year

Pleiades carries gyroscopes that allow it to swivel its telescope in quick time, enabling it to acquire a strip, or mosaic, of images around its target in a single pass overhead.

The Pleiades spacecraft has been assembled by Astrium, Europe's largest space company, with its instrument supplied by Thales Alenia Space (France).

It will have both a civilian and military role, and a number of European countries (Austria, Belgium, Spain and Sweden) have part-funded the project to get access to its pictures.

Pleiades-1 will be followed by Pleiades-2 on a separate Soyuz launch in 2012.

"The fact that we will have two, twin satellites operating in a phased orbit separated by 180 degrees will give us something very powerful - a daily re-visit capacity.

It means we will be able to gather information every day on any part of the globe," explained Charlotte Gabriel Robez, Pleiades project manager with Astrium Geo-information Services.

"This is key because it allows us to tackle applications such as rescue or crisis management, in the aftermath of an earthquake for example," she told BBC News.

The commercial market for very high resolution imagery has become dominated in recent years by the American companies GeoEye and DigitalGlobe, which benefit from multi-billion-dollar contracts with the US intelligence agencies.

Astrium Geo-information Services is hoping these agencies' voracious appetite for pictures will leave a productive hole in the market for Pleiades' products.

The Soyuz rocket flew its inaugural mission from Europe's Sinnamary spaceport in October. A dedicated new launch pad has been constructed in the Guianese jungle for the Russian vehicle.

02 Arena 
A simulated image of London's 02 Arena. The picture shows the detail Pleiades should be able to retrieve