Showing posts with label landscape. Show all posts

Wednesday, August 20, 2014

ESO LaSilla Observatory Captures A spectacular landscape of star formation

This mosaic of images from the Wide Field Imager on the MPG/ESO 2.2-metre telescope at ESO's La Silla Observatory in Chile shows two dramatic star formation regions in the southern Milky Way. 

The first of these, on the left, is dominated by the star cluster NGC 3603, located about 20 000 light-years away, in the Carina-Sagittarius spiral arm of the Milky Way galaxy. 

The second object, on the right, is a collection of glowing gas clouds known as NGC 3576 that lies only about half as far from Earth. 

Credit: ESO/G. Beccari

This image, captured by the Wide Field Imager at ESO's La Silla Observatory in Chile, shows two dramatic star formation regions in the Milky Way.

The first, on the left, is dominated by the star cluster NGC 3603, located 20 000 light-years away, in the Carina-Sagittarius spiral arm of the Milky Way.

The second, is a collection of glowing gas clouds known as NGC 3576 that lies about half as far from Earth.

NGC 3603 is a very bright star cluster and is famed for having the highest concentration of massive stars that have been discovered in our galaxy so far.

At the centre lies a Wolf–Rayet multiple star system, known as HD 97950. Wolf–Rayet stars are at an advanced stage of stellar evolution, and start off with around 20 times the mass of the Sun.

But, despite this large mass, Wolf–Rayet stars shed a considerable amount of their matter due to intense stellar winds, which blast the star's surface material off into space at several million kilometres per hour, a crash diet of cosmic proportions.

NGC 3603 is in an area of very active star formation. Stars are born in dark and dusty regions of space, largely hidden from view.

But as the very young stars gradually start to shine and clear away their surrounding cocoons of material they become visible and create glowing clouds in the surrounding material, known as HII regions.

HII regions shine because of the interaction of ultraviolet radiation given off by the brilliant hot young stars with the hydrogen gas clouds.

HII regions can measure several hundred light-years in diameter, and the one surrounding NGC 3603 has the distinction of being the most massive in our galaxy.

The cluster was first observed by John Herschel on 14 March 1834 during his three-year expedition to systematically survey the southern skies from near Cape Town.

He described it as a remarkable object and thought that it might be a globular star cluster. Future studies showed that it is not an old globular, but a young open cluster, one of the richest known.


This zoom sequence takes the viewer deep into the spectacular southern Milky Way in the constellation of Carina (The Keel). 

We see two regions where stars are forming, the very rich cluster NGC 3603 and its surroundings and the strange glowing gas clouds known as NGC 3576. 

The final detailed views come from images taken with the Wide Field Imager on the MPG/ESO 2.2-metre telescope at ESO’s La Silla Observatory in Chile. 

Credit: ESO/G. Beccari/N. Risinger (skysurvey.org). Music: movetwo 

NGC 3576, on the right of the image, also lies in the Carina–Sagittarius spiral arm of the Milky Way, but it is located only about 9000 light-years from Earth, much closer than NGC 3603, but appearing next to it in the sky. NGC 3576 is notable for two huge curved objects resembling the curled horns of a ram.

These odd filaments are the result of stellar winds from the hot, young stars within the central regions of the nebula, which have blown the dust and gas outwards across a hundred light-years.

Two dark silhouetted areas known as Bok globules are also visible in this vast complex of nebulae. These black clouds near the top of the nebula also offer potential sites for the future formation of new stars.

NGC 3576 was also discovered by John Herschel in 1834, making it a particularly productive and visually rewarding year for the English astronomer.

Tuesday, March 20, 2012

Spy Satellite Images expose 8,000 years of civilization

Hidden in the landscape of the fertile crescent of the Middle East, scientists say, lurk overlooked networks of small settlements that hold vital clues to ancient civilizations.

Beyond the impressive mounds of earth, known as 'tells' in Arabic, that mark lost cities, researchers have found a way to give archaeologists a broader perspective of the ancient landscape.

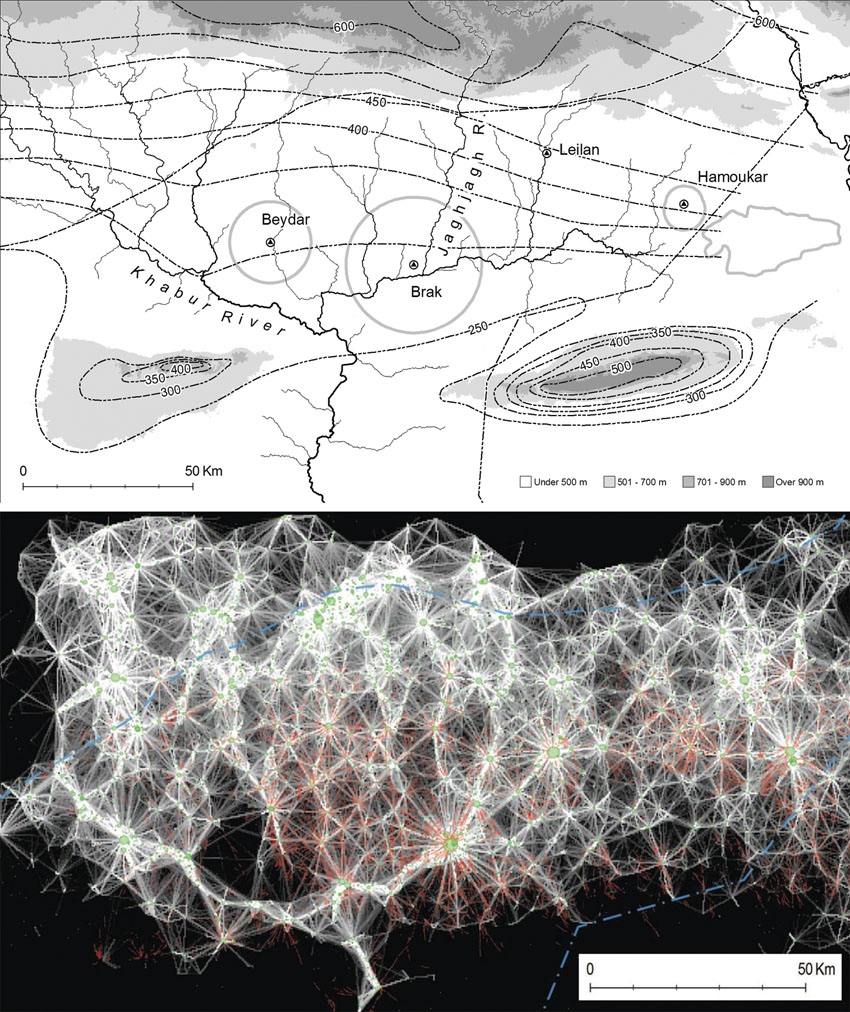
By combining spy-satellite photos obtained in the 1960s with modern multi-spectral images and digital maps of Earth's surface, the researchers have created a new method for mapping large-scale patterns of human settlement.

The approach, used to map some 14,000 settlement sites spanning eight millennia in 23,000 square kilometres of northeastern Syria, is published today in the Proceedings of the National Academy of Sciences.

“Traditional archaeology goes straight to the biggest features, the palaces or cities, but we tend to ignore the settlements at the other end of the social spectrum,” says Jason Ur, an archaeologist at Harvard University in Cambridge, Massachusetts, who is co-author of the study.

“The people who migrated to cities came from somewhere; we have to put these people back on the map.”

Such comprehensive maps promise to uncover long-term trends in urban activity. “This kind of innovative large-scale application is what remote sensing has been promising archaeology for some years now; it will certainly help us to focus our attention on the big picture,” says Graham Philip, an archaeologist at Durham University, UK.

Soil signatures
The satellite-based method relies on the fact that human activity leaves a distinctive signature on the soil, called anthrosols.

Formed from organic waste and decayed mud-brick architecture, anthrosols are imbued with higher levels of organic matter and have a finer texture and lighter appearance than undisturbed soil, resulting in reflective properties that can be seen by satellites.

To sift through satellite images for those signatures, co-author Bjoern Menze, a research affiliate in computer science at the Massachusetts Institute of Technology in Cambridge, built on his skills from his day job identifying tumours in clinical images.

Menze trained software to detect the characteristic wavelengths of known anthrosols in images spanning 50 years of seasonal differences.

This automation was key. “You could do this with the naked eye using Google Earth to look for sites, but this method takes the subjectivity out of it by defining spectral characteristics that bounce off of archaeological sites,” says Ur.

Menze and Ur also used digital elevation data collected in 2000 by the space shuttle as part of NASA's Shuttle Radar Topography Mission (SRTM).

This information enabled the authors to estimate the volume of the larger sites for the first time — and to use this volume as a proxy for a site’s longevity. The bigger the mound, the longer the settlement survived.

Tony Wilkinson, an archaeologist at Durham University and Ur’s former mentor, says that being able to measure the volume of many sites over large areas remotely is a breakthrough.

However, Philip cautions that the resolution of the SRTM data may be too coarse to provide an accurate measurement for the volume of the smaller settlements. Nonetheless, he expects that the method will spark new archaeological insights for several different regions.

Read more at Nature 

Wednesday, February 1, 2012

MARS HiRISE: Landscape Evolution

A review of existing images of Mars reveals a diverse landscape.

In some instances, such as around volcanoes and in valleys, a casual glance suggests the features are much like those here on Earth.

Closer inspection, however, often confirms differences in scale and or subtle characteristics relative to their more familiar terrestrial counterparts.

These same images also reveal a Mars that is often very different form the Earth. Some locations are marked by huge jumbles of blocks forming chaotic terrain, whereas others are buried beneath blankets of dust. Bizarre “thumbprint,” “Swiss cheese,” and other surface textures also occur.

Current limits on the resolution of Mars images often preclude distinguishing the of processes responsible for shaping a landscape.

The geomorphic thresholds that influence the efficiency and intensity of surface modification by different processes can often be hard to define. Indeed, different processes can sometimes produce very similar appearing landforms.

Detecting the subtle, diagnostic signatures of past water erosion versus wind or other processes often requires the high resolution imagery that will be obtained by HiRISE.

It is the analysis of HiRISE images that may provide some of the clues for a better understanding of the evolving Martian landscape.

See more of the Feb 1st HiRise Images

Tuesday, October 18, 2011

NASA Spitzer Image: Swirling Landscape of North America Nebula

This swirling landscape of stars is known as the North America Nebula. It is seen here in Visible Light Spectrum.
.
In visible light above, the region resembles North America, but in this infrared view from NASA's Spitzer Space Telescope, the continent disappears.

Where did the continent go? The reason you don't see it in Spitzer's view has to do, in part, with the fact that infrared light can penetrate dust whereas visible light cannot. 

Dusty, dark clouds in the visible image become transparent in Spitzer's view. 

In addition, Spitzer's infrared detectors pick up the glow of dusty cocoons enveloping baby stars.

Clusters of young stars (about one million years old) can be found throughout the image. Some areas of this nebula are still very thick with dust and appear dark even in Spitzer's view.

The Spitzer image contains data from both its infrared array camera and multi-band imaging photometer. 

Light with a wavelength of 3.6 microns has been colour-coded blue; 4.5-micron light is blue-green; 5.8-micron and 8.0-micron light are green; and 24-micron light is red. This image is from February 2011.

Image Credit: NASA/JPL-Caltech

Monday, August 22, 2011

Researchers Improve GPS Accuracy In The Third Dimension


GPS satellites transmit information in the form of radio waves to the GPS receiver held by the user. At the same time, the signals must also travel to at least one other ground-based receiver to obtain a location reference, which allows the user's receiver in turn to accurately calculate its own position in 3D.

Before the satellite signals reach the receivers, they must travel through atmosphere, which results in time delays that affect accuracy.

When the user's receiver and the reference receiver reside at drastically different altitudes, however, each location experiences different amounts of time delay, which complicates matters even further.

So, in mountainous regions where height differences can vary greatly over a short distance, acquiring the altitude of locations to within a few centimeters is difficult.


Researchers hope that the software, currently being developed, will help to improve the vertical accuracy of measurements in potentially hazardous regions at high altitudes, such as areas of soft, loose land that may be prone to landslides.

They also claim that their software could be used to measure how quickly glaciers at high altitudes are melting.

Tuesday, August 16, 2011

HiRISE Images: Landslides in Valles Marineris

Valles Marineris is the largest canyon in the Solar System: if superposed on a map of the United States, it would stretch all the way from Los Angeles to Washington, D.C., possibly even up to New England!

So this image is just a very small portion of the system.

This observation shows us gully-like landslides (called "mass wasting") on the interior layered deposits of Valles Marineris.

These include alcoves and channels, which are also visible in PSP_004396_1675.

However, that image quality was very poor due to a dust storm, so a re-image can give us fine-scale shapes and sizes.

Friday, November 20, 2009

NASA’s Newest Map of the World

In June 2009, NASA and the U.S. Geological Survey put the finishing touches on a new collection of mapped images covering the entire land surface of the Earth and made them available to anyone, anywhere in the world, absolutely free.

The result of a collaboration between NASA, the U.S. Geological Survey, and the U.S. National Geospatial Agency, the Global Land Survey 2005 features around 9,500 images from NASA’s Landsat satellites captured between 2004–2007.

The images are detailed enough to make out features as small as 30 meters (about one-third the length of an American football field), they have been carefully screened for clouds, and each one shows the landscape during its growing season.

Some of the images are as striking as a piece of artwork. Stitched together into a single mosaic, the collection paints the most detailed picture of Earth’s land surface a person can get for free.

Read the full article here ...........