Showing posts with label El Niño. Show all posts

Thursday, September 25, 2014

El Niño 2014: Ocean Circulation - Signs of a modest return

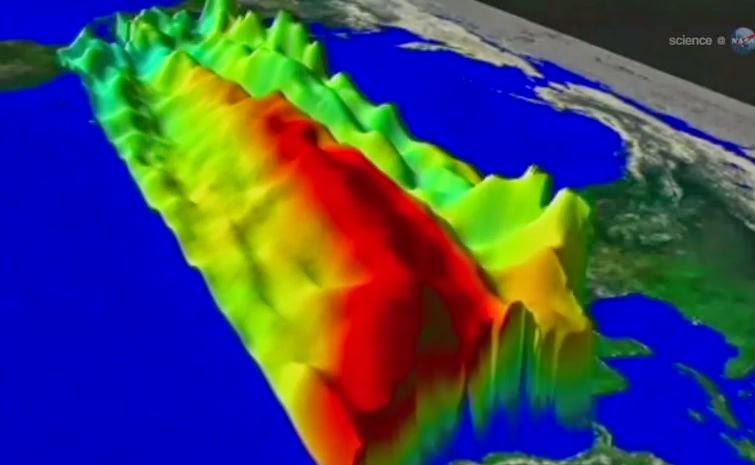
The image shows Kelvin waves of high sea level (red/yellow) crossing the Pacific Ocean at the equator. 

The waves can be related to El Niño events. Green indicates normal sea level, and blue/purple areas are lower than normal. 

Data are from the NASA /European Jason-2 satellite, collected Sept. 13-22, 2014. 

Image credit: NASA/JPL-Caltech

Prospects have been fading for an El Niño event in 2014, but now there's a glimmer of hope for a very modest comeback.

Scientists warn that unless these developing weak-to-modest El Niño conditions strengthen, the drought-stricken American West shouldn't expect any relief.

The latest sea-level-height data from the NASA /European Ocean Surface Topography Mission (OSTM) /Jason-2 satellite mission show a pair of eastward-moving waves of higher sea level, known as Kelvin waves, in the Pacific Ocean, the third such pair of waves this year.

Now crossing the central and eastern equatorial Pacific, these warm waves appear as the large area of higher-than-normal sea surface heights (warmer-than-normal ocean temperatures) hugging the equator between 120 degrees west and the International Dateline.

The Kelvin waves are traveling eastward and should arrive off Ecuador in late September and early October.

A series of larger atmospheric "west wind bursts" from February through May 2014 triggered an earlier series of Kelvin waves that raised hopes of a significant El Niño event.

Just as the warming of the eastern equatorial Pacific by these waves dissipated, damping expectations for an El Niño this year, these latest Kelvin waves have appeared, resuscitating hopes for a late arrival of the event.

For an overview of 2014's El Niño prospects and Kelvin waves, please see: phys.org/news/2014-05-el-nino.html

This latest image highlights the processes that occur on time scales of more than a year but usually less than 10 years, such as El Niño and La Niña.

The image also highlights faster ocean processes such as Kelvin waves. As Patzert says, "Jason-2 is a fantastic Kelvin wave counter."

These processes are known as the interannual ocean signal. To show that signal, scientists refined data for this image by removing trends over the past 21 years, seasonal variations and time-averaged signals of large-scale ocean circulation.

For a more detailed explanation of what this type of image means, visit: sealevel.jpl.nasa.gov/science/… lninopdo/latestdata/

For a time sequence of the evolution of the 2014 El Nino, visit: sealevel.jpl.nasa.gov/science/… /latestdata/archive/

Tuesday, August 19, 2014

Global Warming, Climate Change and solar activity

The number of sunspots (white area here) varies in multi-year cycles. 

As a result, solar irradiance, which influences the Earth's climate, also fluctuates. 

The photo shows a UV image of the sun. 

Credit Image: Trace Project / NASA

The number of sunspots (white area here) varies in multi-year cycles. 

As a result, solar irradiance, which influences the Earth's climate, also fluctuates. The photo shows a UV image of the sun. 

Credit: Trace Project / NASA

The average temperature on Earth has barely risen over the past 16 years. ETH researchers have now found out why, and they believe that global warming is likely to continue again soon.

Global warming is currently taking a break: whereas global temperatures rose drastically into the late 1990s, the global average temperature has risen only slightly since 1998, surprising, considering scientific climate models predicted considerable warming due to rising greenhouse gas emissions.

Climate sceptics used this apparent contradiction to question climate change per se, or at least the harm potential caused by greenhouse gases, as well as the validity of the climate models.

Meanwhile, the majority of climate researchers continued to emphasise that the short-term 'warming hiatus' could largely be explained on the basis of current scientific understanding and did not contradict longer term warming.

Researchers have been looking into the possible causes of the warming hiatus over the past few years. For the first time, Reto Knutti, Professor of Climate Physics at ETH Zurich, has systematically examined all current hypotheses together with a colleague.

In a study published in the latest issue of the journal Nature Geoscience, the researchers conclude that two important factors are equally responsible for the hiatus.

El Niño warmed the Earth
One of the important reasons is natural climate fluctuations, of which the weather phenomena El Niño and La Niña in the Pacific are the most important and well known.

"1998 was a strong El Niño year, which is why it was so warm that year," says Knutti. In contrast, the counter-phenomenon La Niña has made the past few years cooler than they would otherwise have been.

Although climate models generally take such fluctuations into account, it is impossible to predict the year in which these phenomena will emerge, says the climate physicist.

To clarify, he uses the stock market as an analogy: "When pension funds invest the pension capital in shares, they expect to generate a profit in the long term."

At the same time, they are aware that their investments are exposed to price fluctuations and that performance can also be negative in the short term.

However, what finance specialists and climate scientists and their models are not able to predict is when exactly a short-term economic downturn or a La Niña year will occur.

Longer solar cycles
According to the study, the second important reason for the warming hiatus is that solar irradiance has been weaker than predicted in the past few years.

This is because the identified fluctuations in the intensity of solar irradiance are unusual at present: whereas the so-called sunspot cycles each lasted eleven years in the past, for unknown reasons the last period of weak solar irradiance lasted 13 years.

Furthermore, several volcanic eruptions, such as Eyjafjallajökull in Iceland in 2010, have increased the concentration of floating particles (aerosol) in the atmosphere, which has further weakened the solar irradiance arriving at the Earth's surface.

The scientists drew their conclusions from corrective calculations of climate models. In all climate simulations, they looked for periods in which the El Niño/La Niña patterns corresponded to the measured data from the years 1997 to 2012.

With a combination of over 20 periods found, they were able to arrive at a realistic estimate of the influence of El Niño and La Niña.

They also retroactively applied in the model calculations the actual measured values for solar activity and aerosol concentration in the Earth's atmosphere.

Model calculations corrected in this way match the measured temperature data much more closely.

Incomplete measured data
The discrepancy between the climate models and measured data over the past 16 years cannot solely be attributed to the fact that these models predict too much warming, says Knutti.

The interpretation of the official measured data should also be critically scrutinised. According to Knutti, measured data is likely to be too low, since the global average temperature is only estimated using values obtained from weather stations on the ground, and these do not exist everywhere on Earth.

From satellite data, for example, scientists know that the Arctic region in particular has become warmer over the past years, but because there are no weather stations in that area, there are measurements that show strong upward fluctuations. As a result, the specified average temperature is too low.

Last year, British and Canadian researchers proposed an alternative temperature curve with higher values, in which they incorporated estimated temperatures from satellite data for regions with no weather stations.

If the model data is corrected downwards, as suggested by the ETH researchers, and the measurement data is corrected upwards, as suggested by the British and Canadian researchers, then the model and actual observations are very similar.

Warming to recommence
Despite the warming hiatus, Knutti is convinced there is no reason to doubt either the existing calculations for the climate activity of greenhouse gases or the latest climate models.

"Short-term climate fluctuations can easily be explained. They do not alter the fact that the climate will become considerably warmer in the long term as a result of greenhouse gas emissions," says Knutti.

He believes that global warming will recommence as soon as solar activity, aerosol concentrations in the atmosphere and weather phenomena such as El Niño naturally start returning to the values of previous decades.

More information: Huber M, Knutti R: Natural variability, radiative forcing and climate response in the recent hiatus reconciled. Nature Geoscience, online publication 17 August 2014, DOI: 10.1038/ngeo2228

Friday, July 6, 2012

Strong Signs of El Niño Brewing In The Pacific, Causing Global temps to jump to new record highs

Imagine you are slowly filling a bathtub with water, and are measuring how deep the water is at frequent intervals.

Also imagine, that at times your dog jumps in while you’re measuring, and this of course causes you to get a higher water level.

The dog gets back out, and the water level drops slightly, but not as much as it was before because the faucet is still running, and the water is still slowly filling the tub.

Imagine too that the faucet is bad, and that it is slowly opening wider, so the rate of increase is also itself increasing.

The same thing is happening to our planet’s temperature. Increasing greenhouse gases are slowly raising the temperature of the planet, but ocean currents like La Niña and El Niño also have a significant effect.

The gases are increasing at an ever faster rate as well, just like the bad faucet. When there is a La Niña with a large region of cold water in the Pacific, the planet cools (it’s the same as the dog jumping out of the tub).

An El Niño, which fills much of the Pacific with warm water, warms the planet.

It’s the same as the dog jumping into the bath tub.

The water is sloshing up and down, but as long as the faucet is running, you know that in the long run the water level is going up.

If an El Niño does indeed develop later this summer and linger into the Northern Hemisphere winter then we will likely see a new record temperature for the planet.

The super El Niño of 1998 brought us a very warm planet and the following La Niña cooled us back somewhat.

Since then, we have started rising again, and in spite of last year’s La Niña we have seen the planet get even warmer.

The cooling after the 98 El Niño led political extremists (with little or no knowledge of atmospheric science) to boldly claim that climate change stopped in 1998.

Hopefully, you can now see what a load of pure poppycock that is.

So here are some real facts. You know, the kind of thing that North Carolina legislators need to outlaw as soon as possible:

1. The World will see an increase in droughts and floods over the upcoming year. How bad it will be varies with each El Niño. Most likely, Australia will get the drought and the Gulf Coast will get the floods.
2. The number of Atlantic hurricanes will likely drop, but other factors can override this to a significant degree.
3. 15 of the last 16 years have been the warmest on record and there will likely be a new record warm year on the books for planet Earth.
4. The few remaining skeptics will claim that it is all just a natural cycle, which is partially true!
Interesting isn’t it, how a partial truth can be the biggest of lies.


Read the full article here: El Nino Report

Friday, November 13, 2009

El Niño is gathering pace in the Pacific

El Niño is experiencing a late-fall resurgence. Recent sea-level height data from the Ocean Surface Topography Mission/Jason-2 oceanography satellite show that a large-scale, sustained weakening of trade winds in the western and central equatorial Pacific during October has triggered a strong, eastward moving, wave of warm water, known as a Kelvin wave.

In the central and eastern equatorial Pacific, this warm wave appears as the large area of higher-than-normal sea surface heights (warmer-than-normal sea surface temperatures) between 170 degrees east and 100 degrees west longitude. A series of similar, weaker events that began in June 2009 initially triggered and has sustained the present El Niño condition.

This image was created with data collected by the U.S./French satellite during a 10-day period centered on November 1, 2009. It shows a red and white area in the central and eastern equatorial Pacific that is about 10 to 18 centimeters (4 to 7 inches) above normal. These regions contrast with the western equatorial Pacific, where lower-than-normal sea levels (blue and purple areas) are between 8 to 15 centimeters (3 and 6 inches) below normal. Along the equator, the red and white colors depict areas where sea surface temperatures are more than one to two degrees Celsius above normal (two to four degrees Fahrenheit).

"In the American west where we are struggling under serious drought conditions, this late-fall charge by El Niño is a pleasant surprise, upping the odds for much needed rain and an above-normal winter snowpack," said JPL oceanographer Bill Patzert.