Showing posts with label weather. Show all posts

Thursday, December 11, 2014

Severe North Atlantic cyclone strikes Ireland and UK

A very deep area of low pressure resulted in a North Atlantic cyclone (named Alexandra) which caused massive ocean surges and brought strong winds to parts of Ireland and the UK.

Met-10/Metop-B, 09 December 2014, 12:00 UTC 

Airmass RGB, with surface pressure and ASCAT winds 

Credit: EUMeTrain

Gale force gusts of more than 129 km/h (80 mph) were recorded at Tiree in Scotland and ocean waves over 15 m (50 ft) high were recorded by the K5 buoy off the north west coast of Scotland (59.10N, 11.40W)

The strong winds caused transport chaos and power outtages across the Northern parts of the UK.

The gales and ocean surges were caused by rapid or explosive cyclogenesis — an intense low pressure system with a central pressure that falls 24 hPa in a 24-hour period, referred to colloquially as a 'weather bomb'.

In EUMETSAT weather blog, ITV weather forecaster Liam Dutton explained how the jet stream caused the cyclogenesis.

The Airmass RGB image from 9 December 12:00 UTC (left side) shows the system had a central pressure of less than 950 hPa.

Met-10, 10 December 2014, 06:00 UTC.

Airmass RGB with 10 m ECMWF model winds 

Credit: EUMeTrain

The ASCAT instrument on Metop measured 60 knots (111 km/h), but the real winds were probably higher as ASCAT winds saturate at around 60 knots (higher winds than 60 knots do not produce a higher ASCAT signal).

Also striking in this image are the strong winds over the Western Mediterranean caused by Mistral winds (two storms caught in one image).

The Airmass RGB image from 10 December 06:00 UTC (right side) shows the very large fetch zone of the storm, which is ideal (conditions) for forming high (monster) waves and very large ocean surge.


Thursday, December 4, 2014

Typhoon Hagupit about to Smash into Philipines


The anticipated arrival in Eastern Samar province on Saturday of Typhoon Hagupit, Filipino for "smash" comes a year after Typhoon Haiyan left more than 7,300 dead as it swept inland along the same route.

Meteorologists tracking it over the Pacific, 435 miles off the country's eastern coast, say it has sustained winds of 127mph and gusts as high as 149mph.

Haiyan survivor Emily Sagales said many of her neighbours in central Tacloban city, which was ravaged by Haiyan, had packed their clothes and fled to a sports stadium and safer homes of relatives.

She said long queues had formed at food stores and petrol stations as residents stocked up on basic goods.

The 23-year-old, who saw her mother-in-law killed and her home washed away in Haiayan, gave birth to her first child in a crowded makeshift clinic following the disaster.

"The trauma has returned," she said.

"It's worse now because I didn't have a baby to worry about last year."

Haiyan destroyed around one million homes and displaced some four million people in the central Philippines, and hundreds of residents still living in tents in Tacloban have been prioritised in an ongoing evacuation.

Hotels in Tacloban, a city of more than 200,000 people still struggling to recover from last year's damage, were running out of rooms as wealthier families booked ahead for the weekend.

Roan Florendo, of the hilltop Leyte Park hotel, said: "The sun is still shining but people are obviously scared. Almost all of our rooms have been booked."

The military has been put on full alert and evacuation centres have been opened, while food packs, medicines and body bags have been transported to far-flung villages that could be cut off by heavy rains.

In capital Manila, President Benigno
Aquino III held an emergency meeting of disaster-response agencies and ordered steps to prevent panic-buying and hoarding of goods.

He checked on the readiness of Philippine air force aircraft, hospitals and police contingency plans, amid fears of a repeat of the looting that happened in Tacloban after Haiyan crippled the city's police force.

"I think we've been challenged worse by Yolanda," Mr Aquino said, referring to Haiyan's local name.

Wednesday, October 22, 2014

Researchers construct a model of impact for El Nino / La Nina events

The 1997 El Nino seen by TOPEX/Poseidon

Credit: NASA

A small team made up of researchers from the U.S. and Europe has constructed a model that helps map parts of the world that are most at risk of flooding due to El Niño/La Niña events.

In their paper published in Proceedings of the National Academy of Sciences, the team describes how they compared weather data over the past half century with economic impacts of actual floods to create a model that may soon be used to help predict flooding events in the future.

By now, most everyone has heard about El Niño/La Niña weather events, El Niño is where warm water west of South America causes more rain to fall in some places.

La Niña is where the same waters are cooler than normal resulting in different changes to rain patterns.

Perhaps less well known is that such events have a worldwide impact, causing more flooding than normal in some parts of the world and less in others.

Ofen the flooding results in damage to property and loss of life, thus it would be a good thing if forecasts could be made, warning people in areas most at risk.

Unfortunately, up till now, such forecasts have not been available because such events don't always cause the same types of flooding in the same places.

In this new effort, the researchers sought to provide a model for building such a forecasting ability by using data over a long period of time.

"El Niño Southern Oscillation (ENSO) is the most dominant interannual signal of climate variability and has a strong influence on climate over large parts of the world."

"In turn, it strongly influences many natural hazards (such as hurricanes and droughts) and their resulting socioeconomic impacts, including economic damage and loss of life."

"However, although ENSO is known to influence hydrology in many regions of the world, little is known about its influence on the socioeconomic impacts of floods (i.e., flood risk)."

The research team obtained weather data for the years 1959 to 2000, pulling out periods of El Niño/La Niña weather events which they then compared with reports of damage due to flooding.

Next they compared those results with flood reports during normal times and used what they found to create a model.

The model showed that during El Niño events, 34 percent of the Earth's surface had higher or lower than normal amounts of flooding, that number jumped to 38 percent for La Niña weather events.

The model also showed which parts of the planet are more susceptible on average, to flooding due to such events.

The Southwest in the U.S. for example and parts of South America, both experience more flooding during El Niño events, while places like the Sahel in Africa, and most of Australia experience less.

The research team acknowledges that their model is still in its infancy but believe that over time, as more research is conducted, it will improve to the point that it will be useful in helping areas prepare for flooding during El Niño/La Niña weather events.

More information: Strong influence of El Niño Southern Oscillation on flood risk around the world, PNAS, Philip J. Ward, DOI: 10.1073/pnas.1409822111

Tuesday, October 7, 2014

NASA HIWRAP: High-Altitude Imaging Wind and Rain Airborne Profiler


This new animation from NASA shows how a remarkable instrument called the HIWRAP looks into tropical cyclones at wind, rain and ice to analyze storm intensity.

The HIWRAP is the High-Altitude Imaging Wind and Rain Airborne Profiler, a "conically scanning" Doppler radar, meaning it scans in a cone-shaped manner.

Wind measurements are crucial for understanding and forecasting tropical storms since they are closely tied to the overall dynamics of the storm.

The HIWRAP instrument is able to measure line-of-sight (along the radar beam) and because it scans in a cone beneath the aircraft, it gets two looks at most parts of the storm, allowing calculations of the 3-dimensional wind and rain fields. In the absence of rain, it can also measure ocean surface winds.

HIWRAP while flying on board an aircraft is capable of examining storms down to a very small scale.

"HIWRAP allows us to see how strong bursts of thunderstorms contribute to the intensification of the low-level wind field in hurricanes," said Research Meteorologist Scott Braun of NASA's Goddard Space Flight Center in Greenbelt, Maryland.

The 2 minute visualisation shows how scans from the HIWRAP instrument are done in a cone-like shape over storms, measuring winds within heavy rain throughout.

"What's interesting about the HIWRAP Doppler radar is that it's a dual-frequency and dual-beam radar," said Gerry Heymsfield, Cloud Radar Expert and Research Meteorologist from NASA Goddard. "That means it has two frequencies that measure at two different angles."

The instrument scans in a cone shape toward the surface, with the peak of the cone at the HIWRAP radar on the aircraft.

"As the plane flies over a particular target-say the eyewall of a storm- scanning it with a cone-shape provides views of the same region from different directions. That's what allows scientists to measure the three-dimensional winds and precipitation within the storm."

The video shows that the HIWRAP sends out about 5,000 pulses a second to get an accurate read on precipitation particles, like rain or ice as the storm and the aircraft are both moving.

The signals that bounce back reveal the type, size and distribution of rain or ice particles, as well as how fast the particles are moving. The speed of the particles can help determine the wind and circulation in a storm.

Tuesday, August 5, 2014

NASA TRMM Satellite: Heavy Storms in the eye of Hurricane Iselle - video

NASA's TRMM Satellite found storms in Iselle's eye wall reaching from 13km (8 miles) high and very heavy rain falling at a rate of almost 182 mm (about 7.2 inches) per hour in Iselle's eye wall. Credit: SSAI/NASA, Hal Pierce


NASA's TRMM Satellite found storms in Iselle's eye wall reaching from 13km (8 miles) high and very heavy rain falling at a rate of almost 182 mm (about 7.2 inches) per hour in Iselle's eye wall. 

Credit: SSAI/NASA, Hal Pierce

NASA's Tropical Rainfall Measuring Mission satellite (TRMM) flew directly over the eye of powerful Hurricane Iselle and found extremely heavy rainfall rates occurring there.

On August 4, 2014 at 1037 UTC (6:37 a.m. EDT) when TRMM passed over the storm, Iselle had winds of about 120 knots (about 138 mph) at that time making it a dangerous category four hurricane on the Saffir-Simpson hurricane wind scale.

Rainfall from TRMM's Microwave Imager (TMI) and Precipitation Radar (PR) instruments was overlaid on an enhanced infrared image from NOAA's GOES-West satellite that showed cloud extent.

The composite image showed the diameter of the storm and the rate in which rain was falling within it.

The TRMM PR saw rain falling at a rate of almost 182 mm (about 7.2 inches) per hour in Iselle's eye wall.

TRMM data was also used to create a 3-D image of the storm to help forecasters see cloud heights.

At NASA's Goddard Space Flight Center in Greenbelt, Maryland, a 3-D image was produced using radar reflectivity values from TRMM's Precipitation Radar (PR) instrument

The 3-D image showed storms in Iselle's eye wall reaching from 13km (8 miles) to the surface of the ocean below.

NASA Earth Observation GOES: Hurricane Iselle threatens Hawaii

Hurricane Iselle is pictured in the Eastern Pacific Ocean on August 3, 2014

Hurricane Iselle picked up strength in the open Pacific on Monday as the powerful storm barrelled toward Hawaii, US forecasters said.

The NOAA Miami-based National Hurricane Centre upgraded Iselle, now some 1,245 miles (2,005 kilometers) east of Hilo, Hawaii, to a Category Four storm on the five-level Saffir-Simpson scale.

Earlier Monday, it had been listed as a Category Three storm.

NOAA's GOES-West satellite captured this image of a very active Eastern and Central Pacific, hosting three tropical cyclones (from left to right) Genevieve, Iselle and Julio.

Image Credit: NASA/NOAA GOES Project

NASA and NOAA satellites have been supplying forecasters with data developing tropical cyclones in the Eastern and Central Pacific Ocean and over the last several days. There have been as many as five tropical systems at the same time.

On Monday, August 4, there were three tropical systems stretching from west to east: Tropical Depression Genevieve in the Central Pacific, Hurricane Iselle and Tropical Storm Julio in the Eastern Pacific.

This false-colored image represents infrared data on Tropical Storm Iselle on July 31 at 5:23 p.m. EDT from the AIRS instrument aboard NASA's Aqua satellite.

Image Credit: NASA JPL

Tropical Depression Genevieve Strengthens
On August 4, Tropical Depression Genevieve was located about 930 miles (1,495 km) southwest of Honolulu, Hawaii. Maximum sustained winds were still near 35 mph (55 kph).

Genevieve was moving westward at about 16 mph (26 kph). NOAA's Central Pacific Hurricane Center forecasts gradual strengthening late on August 4 and 5, so Genevieve could once again reach tropical storm status.

To the east of Genevieve lies low pressure area known as System 93C. It is producing disorganized showers and thunderstorms.

System 93C is located about 500 miles south of Hilo, Hawaii. This low pressure area is moving to the west at 15 mph and currently has a near zero percent chance of becoming a tropical depression over the next couple of days.

Wednesday, July 9, 2014

NASA's RapidScat to Unveil Hidden Cycles of Sea Winds

Credit: JPL/NASA

Ocean waves, the hot sun, sea breezes, the right combination makes a great day at the beach.

A different combination makes a killer hurricane.

The complex interactions of the ocean and the air above it that can create such different outcomes are not yet fully known.

Scientists would especially like to understand the role that the daily heat of the sun plays in creating winds.

In a few months, NASA will send an ocean wind-monitoring instrument to a berth on the International Space Station.

That unique vantage point will give the International Space Station Rapid Scatterometer (ISS-RapidScat), the ability to observe daily (also called diurnal) cycles of wind created by solar heat.

Winds contribute to motion in the ocean on every scale, from individual waves to currents extending thousands of miles.

They affect local weather as well as large-scale, long-term climate patterns such as El Niño.

Across the tropical Pacific, winds help or hinder local economies by allowing nutrient-rich water to well up from the ocean depths, nourishing marine life to the benefit of coastal fisheries, or blocking its upwelling.

Since the hours of daylight are totally predictable, you might expect their influence on winds to be equally obvious. But that's not the case.

According to Sarah Gille, an oceanographer at Scripps Institution of Oceanography, San Diego, "There's an enormous amount of diurnal wind variation between 30 degrees north and south of the equator, and we don't understand the timing. It's clear that the winds aren't just triggered every day at noon [when the sun is highest]."

Scatterometer observations from satellites have proven invaluable for understanding ocean winds.

A scatterometer is a type of radar that bounces microwaves off Earth's surface and measures the strength and direction of return signals.

The more uneven the surface, the stronger the return signals. On the ocean, higher winds create larger waves and therefore stronger return signals.

The return signal also tells scientists the direction of the wind, because waves line up in the direction the wind is blowing.

The reason spaceborne scatterometers haven't helped much with the specific question of daily wind cycles has to do with their orbits.

All modern instruments have been in sun-synchronous orbits, in which a satellite is always oriented at the same angle relative to the sun.

In this type of orbit, a satellite passes over every location at the same fixed times, for example, 6 a.m. and 6 p.m. over the equator.

The resulting data can't throw much light on the question of how winds develop over the course of a day.

More information: For more information about ISS-RapidScat, visit: winds.jpl.nasa.gov/missions/RapidScat/

Thursday, July 3, 2014

Tropical Storm Arthur captured on video from the ISS


The International Space Station captures footage of tropical storm Arthur, the first named storm of the Atlantic hurricane season, churning off the coast of Florida on Wednesday.

The worst of the storm should occur at Cape Hatteras, North Carolina, around dawn on Friday, with three to five inches of rain and sustained winds up to 85 mph.

Arthur threatens to spoil 4 July celebrations along the East coast, with warnings of heavy rain, strong wind and dangerous rip currents

Tuesday, April 15, 2014

NASA TRMM: Tropical Cyclone Ita's Australian encounter

This TRMM satellite rainfall map covers Tropical Cyclone Ita's life from April 1-14. 

Highest isolated rainfall was estimated around 400 mm/15.7 inches west of both Ingham and Townsville, Queensland. 

Ita's locations at 0600 UTC are shown overlaid in white. 

Credit: SSAI/NASA/JAXA, Hal Pierce

After coming ashore on April 11, Tropical Cyclone Ita dropped heavy rainfall over the weekend that caused flooding in many areas of northeastern Australia's state of Queensland.

The Tropical Rainfall Measuring Mission satellite (TRMM) satellite gathered data on rainfall that was used to create a rainfall map at NASA.

TRMM satellite
TRMM satellite is managed by both NASA and JAXA, the Japan Aerospace Exploration Agency.

At NASA's Goddard Space Flight Center in Greenbelt, Md. Hal Pierce created a TRMM-based near-real time Multi-satellite Precipitation Analysis (TMPA).

The TMPA precipitation data covered the period from April 1 to 14, 2014 which starts when Ita formed in the Coral Sea and moved along northeastern Australia's coast.

This TRMM satellite rainfall map estimated that some of the largest isolated rainfall totals were near 400 mm/15.7 inches west of both Ingham and Townsville, Queensland.

A 3-D image of Ita was made at NASA using data collected by the TRMM satellite on April 14, 2014 at 0416 UTC/12:16 a.m. EDT after the tropical storm moved back into the Coral Sea.

TRMM's Precipitation Radar (PR) instrument found that the weakening tropical cyclone was still dropping rainfall at a maximum rate of over 161 mm/6.3 inches per hour over the Coral Sea.

The 3-D image, created using TRMM PR data, showed that some storms within Ita were still reaching heights of over 13 km/8 miles as it was becoming extra-tropical.

NOAA's Suomi NPP satellite
Another NASA-shared satellite captured a visible look at Ita's remnants on April 15. The Visible Infrared Imaging Radiometer Suite (VIIRS) instrument aboard NASA-NOAA's Suomi NPP satellite captured a look at the dying extra-tropical storm.

VIIRS collects visible and infrared imagery and global observations of land, atmosphere, cryosphere and oceans.

This 3-D image shows the structure of Tropical Cyclone Ita on April 14 at 0416 UTC/12:16 a.m. EDT. 

Some storms within Ita were still reaching heights of over 13 km/8 miles. 

Credit: SSAI/NASA/JAXA, Hal Pierce

When Suomi flew over Extra-Tropical Storm Ita on April 15 at 3:53 UTC/April 14 at 11:53 p.m. EDT, VIIRS visible data revealed that Ita's structure had elongated more than the previous day.

The VIIRS image showed that strong northwesterly wind shear continued to hammer the storm because the bulk of the storm's clouds were pushed southeast of the center.

Tropical Cyclone Ita's remnants have taken on more of a frontal appearance today as they continue to weaken at sea.

This visible image of an elongated Tropical Cyclone Ita was taken from the VIIRS instrument aboard NOAA's Suomi NPP satellite on April 15 at 3:53 UTC and shows that wind shear has blown most clouds and thunderstorms south of the center. 

Credit: NRL/NASA/NOAA

Wednesday, March 12, 2014

NASA GPM: Contributing to Earth observations from space

The NASA NPOL radar station (left) and D3R Radar station (right) precipitation radars deployed south of Waterloo, Iowa, for the Iowa Flood Studies ground measurement campaign. 

Credit: NASA/Matt Schwaller

The Global Precipitation Measurement (GPM) Core Observatory, launched on Feb. 27 from Tanegashima Space Center in Japan, will help advance our understanding of Earth's water and energy cycles, improve the forecasting of extreme events that cause natural disasters, and extend current capabilities of using satellite precipitation information to directly benefit society.

The GPM mission will provide unprecedented data on rain and snowfall. The science instruments on the GPM Core Observatory will provide data that will yield the greatest clarity on rain and snow yet gathered from orbiting spacecraft.

With GPM, scientists will gather vast amounts of precipitation data on a global scale. But, how do they know how to interpret the data? How do scientists know the data is correct?

This is where ground validation contributes to the mission. Using instruments that complement and correlate with those on the spacecraft, scientists on the ground gather similar precipitation data.

These data are directly compared with that from satellites to improve the models relying on the satellite data.

Walt Petersen, GPM ground validation scientist from NASA's Wallops Flight Facility at Wallops Island, Va., said, "GPM ground validation is a) the process by which we identify uncertainties in satellite-based precipitation products compared to ground observations"

"b) how we improve satellite-based methods of estimating precipitation by better understanding precipitation physics."

"c) how this physics relates to what the instruments 'see,' and d) assess the utility of GPM products in monitoring the global water cycle, flood and weather prediction, and e) al this adds to and aids our understanding of climate change."

This is an artist's depiction of NASA's Global Precipitation Measurement mission's Core Observatory. 

Credit: NASA

The GPM program uses remote campaigns and a Precipitation Science Research Facility at Wallops to supplement and correlate the data gathered by Earth-orbiting satellites.

"Ground validation is central to understanding the quality of GPM precipitation products, how the products can be improved, and evaluating the utility of the measurements in a variety of earth system science applications," Petersen said.

The remote campaigns, using instrumented aircraft and ground-based instruments, allow scientists to monitor precipitation under a variety of conditions and geographic regions.

Petersen said, "The Wallops Precipitation Research Facility collects multi-frequency dual-polarimetric radar observations of precipitation rates, types, sizes and shapes through the depth of the troposphere."

"We collect high quality, concentrated rain gauge network measurements of area-mean rainfall, and use networks of imaging instrumentation to observe the number and distributions of the size, shape and type of precipitation particles falling to ground."

"Collectively, these measurements enable us to describe precipitation physical properties over scales ranging from that of an individual rain drop or snowflake to that of the Delmarva and Chesapeake Bay regions."

With ground validation, scientist will be able to gauge the quality of Earth observations from space using GPM and improve combined space- and ground-based data products used to understand global precipitation.

Thursday, May 30, 2013

BRITE Constellation Satellite Mission

Each BRITE satellite -- about the size and mass of a car battery -- houses a small optical telescope feeding a CCD detector

BRITE Constellation represents new frontiers in aerospace technology and astrophysical science.

BRITE stands for "BRIght Target Explorer," because the targets in the sky for this mission are the most luminous stars in our galaxy.

It's a "constellation" because there will eventually be six BRITE satellites in orbit, monitoring the sky regularly for years to come.

Each BRITE satellite -- about the size and mass of a car battery -- houses a small optical telescope feeding a CCD detector.

Canadian aerospace technology is at the heart of the BRITE design, and Canadian astronomers have partnered with colleagues in Austria and Poland to make the mission a reality.

Each country is contributing a set of twins to the planned sextuplet of satellites. The first two BRITE nanosatellites were launched in late February, and it's expected all six will be in orbit by the end of 2014.

Focusing on the brightest stars in the sky, visible on a clear dark night with the unaided eye, the tiny BRITE eyes will measure subtle changes in the brightnesses of these stars.

The changes can be oscillations in brightness due to actual physical vibrations of the star, which astronomers translate into the otherwise hidden internal structure through a technique called stellar seismology.

The changes can be due to spots on the stars' surfaces -- bad complexions which alternate between 'breakouts' and 'clear skin', like our Sun's 11-year sunspot activity cycle.

The changes can also be due to ejections of gas from a star's surface, like the Sun's wind and its flares.

Sometimes the changes are not due to the star itself, but caused by a planet passing in front of the star, causing dips in the star's apparent brightness.

BRITE Constellation will capture all these types of changes in hundreds of stars to be monitored, and the mission is expected to discover new planets.

Read more of this article here:

Thursday, May 16, 2013

The Mighty Winds of Uranus and Neptune

This image of Uranus was obtained in 2005 by the Hubble Space Telescope. Rings, southern collar and a bright cloud in the northern hemisphere are visible.

CREDIT: NASA, ESA, and M. Showalt

The powerful winds of Uranus and Neptune are apparently confined to tight layers in both planets, researchers have determined.

These findings could shed light on how those immensely strong winds are born, and how giant planets form and evolve over time, scientists added.

Giant planets in the outer solar system, like Uranus and Neptune, are dominated by winds that can reach supersonic speeds and jet streams 10 to 15 times stronger than those found on Earth, judging by images of how clouds race by on those worlds.

Yohai Kaspi
However, just how deep those winds reached was unknown until now, hidden as those lower depths are beneath those dense layers of clouds.

"This has been an open question for the last 25 years," study lead author Yohai Kaspi, a planetary scientist at the Weizmann Institute of Science in Rehovot, Israel, told reporters.

This image shows schematic of the jet streams on the planet Neptune. Scientist have found that the atmosphere's circulation is characterized by westward flow near the equator with velocities reaching 750 mph (1200 km/hr), and an eastward flow at higher latitudes in both the northern and southern hemispheres with velocities reaching 560 mph (900 km/hr). 

The wind velocities decay towards the planet's dense fluid interior. Image released May 15, 2013. 

CREDIT: Yohai Kaspi, Weizmann Institute of Science/NASA

Kaspi and his colleagues focused on Uranus and Neptune, which are both "ice giants" — massive planets with icy atmospheres.

The winds of Uranus can blow clouds up to 560 miles per hour (900 kilometers per hour), while Neptune's winds can reach up to 1,500 miles per hour (2,400 kilometers per hour), the fastest planetary winds detected yet in the solar system.

The researchers investigated the gravity fields of those worlds using data gathered by NASA's Voyager 2 spacecraft and ground-based telescopes.

The strength of a planet's gravity field depends on its amount of mass, and this strength can vary over the surface of a planet depending on the amount of mass lying under it.

By analyzing the gravity fields of these worlds, the investigators could deduce how their atmospheres circulated.

The scientists discovered the winds blow in relatively thin weather layers no more than 600 miles (1,000 kilometers) deep on both planets. For comparison, Neptune is about 30,600 miles (49,250 km) in diameter, while Uranus is approximately 31,500 miles (50,700 km) wide.

These findings help reveal how these winds originate, researchers said.

Past studies have suggested the winds on Uranus and Neptune might arise one of two ways — either shallow processes in their outer atmospheres, or deeper atmospheric mechanisms extending into their interiors.

The researchers found the windy layers of Uranus and Neptune occupy the outermost 0.15 and 0.2 percent of their masses, respectively, suggesting that shallow processes drive those winds, such as swirling caused by moisture condensing and evaporating in the atmosphere.

This image of Neptune was captured by NASA's Voyager 2 spacecraft during an August 1989. Neptune's Great Dark Spot dominates the center along with bright, white. To the south is the bright feature nicknamed "Scooter." 

Still farther south is the "Dark Spot 2," which has a bright core. Each feature moves eastward at a different velocity, so it is only occasionally that they appear close to each other as shown here 

CREDIT: NASA

The new study has implications for how scientists understand how planets form.

"When it comes to thinking about the effects of dynamics on planetary formation, we're saying the bottom 90 percent of giant planets is static," Kaspi said.

In the future, the Cassini spacecraft currently orbiting Saturn and NASA's Juno probe that is scheduled to reach Jupiter can analyze the gravity fields of those giant planets and help better explain their winds as well.

Thursday, May 9, 2013

MARS MRO Image: North Pole Weather forecasts

In winter a layer of frozen carbon dioxide covers the Martian North Pole. 

Approximately 50 percent of this ice cap falls to the ground as snow. 

This image was taken by NASA's Mars Reconaissance Orbiter (MRO) in 2006. 

Credits: NASA

In the north of the red planet snowfalls occur with great regularity.

Expeditions of Mars rovers into this region could therefore be easily planned.

Snowstorms lashing down at the northern hemisphere of Mars during the icy cold winters may be predicted several weeks in advance, say researchers from the Tohoku University in Sendai (Japan) and the Max Planck Institute for Solar System Research (MPS) in Katlenburg-Lindau (Germany) in their newest publication.

For the first time, the scientists' calculations show a connection between these snowfalls and a special Martian weather phenomenon: fluctuations of pressure, temperature, wind speeds, and directions that in the northern hemisphere propagate in a wave-like manner and occur very regularly.

For missions to the red planet exploring this region with rovers, such weather forecasts would offer the possibility of choosing a route that avoids heavy snow storms.

The Martian polar regions are an icy cold world. Similar to those on Earth they are covered by cohesive ice caps. In winter, when the temperatures drop below -128 degrees Celcius, this layer of ice is mainly supplied by frozen carbon dioxide from the atmosphere.

The ice caps then cover a region reaching south to about 70 degrees northern latitude. Only in the comparably warm Martian summer the carbon dioxide sublimates revealing the planet's eternal ice: a considerably smaller cap of frozen water.

Dr. Paul Hartogh
"Mars' seasonal ice has two different origins", says Dr. Paul Hartogh from the MPS. "A part of the carbon dioxide from the atmosphere condensates directly on the surface – similar to the way a layer of frost forms on Earth in cold, clear weather. Another part freezes in the atmosphere", he adds.

The tiny ice crystals accumulate into clouds and fall to the ground as snow.

In the new study, the researchers were now for the first time able to establish a connection between the occurrence of such ice clouds and a wave-like weather phenomenon characterized by a periodic change of pressure, temperature, wind speed, and -direction.

"This weather phenomenon on Mars is unique", says Dr. Alexander Medvedev from the MPS. Indeed, these so-called planetary waves can also be found in Earth's meteorology.

However, not only are the oscillations in pressure and temperature in the lower atmosphere much weaker here. They also occur much less regularly and their wave characteristics are much less pronounced.

"In the Martian northern hemisphere between fall and spring these waves can be found with astonishing reliability", the physicist adds. They propagate eastward with a uniform period of five to six days. Close to the surface, waves with higher frequencies can also be observed.

Thursday, April 11, 2013

Saturn's Rings: Charged Water Particles Falling like Rain

This artist's concept illustrates how charged water particles flow into the Saturnian atmosphere from the planet's rings, causing a reduction in atmospheric brightness. 

The observations were made with the W.M. Keck Observatory on Mauna Kea, Hawaii, with NASA funding

The analysis was led by the University of Leicester, England. 

Credit: NASA /JPL-Caltech /Space Science Institute /University of Leicester

A new study tracks the "rain" of charged water particles into the atmosphere of Saturn and finds there is more of it and it falls across larger areas of the planet than previously thought.

The study, whose observations were funded by NASA and whose analysis was led by the University of Leicester, in the UK, reveals that the rain influences the composition and temperature structure of parts of Saturn's upper atmosphere.

The paper appears in this week's issue of the journal Nature.

"Saturn is the first planet to show significant interaction between its atmosphere and ring system," said James O'Donoghue, the paper's lead author and a postgraduate researcher at Leicester.

"The main effect of ring rain is that it acts to 'quench' the ionosphere of Saturn. In other words, this rain severely reduces the electron densities in regions in which it falls."

O'Donoghue explains that the ring's effect on electron densities is important because it explains why, for many decades, observations have shown those densities to be unusually low at certain latitudes on Saturn.

The study also helps scientists better understand the origin and evolution of Saturn's ring system and changes in the planet's atmosphere.

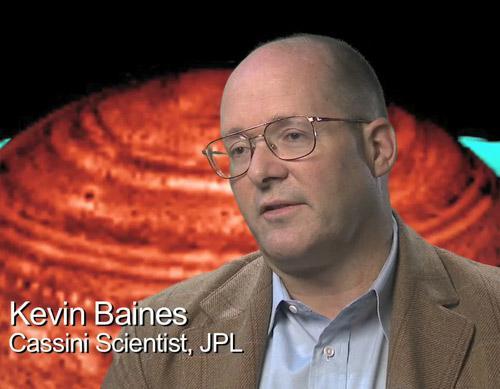
"It turns out that a major driver of Saturn's ionospheric environment and climate across vast reaches of the planet are ring particles located some 36,000 miles [60,000 kilometers] overhead," said Kevin Baines, a co-author on the paper, based at NASA's Jet Propulsion Laboratory, Pasadena, Calif.

"The ring particles affect both what species of particles are in this part of the atmosphere and where it is warm or cool."

In the early 1980s, images from NASA's Voyager spacecraft showed two to three dark bands on Saturn, and scientists theorized that water could have been showering down into those bands from the rings.

Those bands were not seen again until this team observed the planet in near-infrared wavelengths with the W.M Keck Observatory on Mauna Kea, in Hawaii, in April 2011.

The effect was difficult to discern because it involves looking for a subtle emission from bright parts of Saturn.

It required an instrument like that on Keck, which can split up a large range of light.

The ring rain's effect occurs in Saturn's ionosphere, where charged particles are produced when the otherwise neutral atmosphere is exposed to a flow of energetic particles or solar radiation.

When the scientists tracked the pattern of emissions of a particular hydrogen ion with three protons (triatomic hydrogen), they expected to see a uniform planet-wide infrared glow.

What they observed instead was a series of light and dark bands -- with areas of reduced emission corresponding to water-dense portions of Saturn's rings and areas of high emission corresponding to gaps in the rings.

They surmised that charged water particles from the planet's rings were being drawn towards the planet along Saturn's magnetic field lines and were neutralising the glowing triatomic hydrogen ions.

This leaves large "shadows" in what would otherwise be a planet-wide infrared glow. These shadows cover some 30 to 43 percent of the planet's upper atmosphere surface from around 25 to 55 degrees latitude.

This is a significantly larger area than suggested by images from NASA's Voyager mission.

Both Earth and Jupiter have an equatorial region that glows very uniformly. Scientists expected this pattern at Saturn, too, but they instead saw dramatic differences at different latitudes.

Journal Reference:
J. O’Donoghue, T. S. Stallard, H. Melin, G. H. Jones, S. W. H. Cowley, S. Miller, K. H. Baines, J. S. D. Blake. The domination of Saturn’s low-latitude ionosphere by ring ‘rain’. Nature, 2013; 496 (7444): 193 DOI: 10.1038/nature12049

Wednesday, January 16, 2013

SUOMI NPP VIIRS: Raytheon's Visible Infrared Imager Radiometer Suite

VIIRS was launched into orbit aboard the Suomi NPP satellite in October 2011.

Raytheon's Visible Infrared Imager Radiometer Suite (VIIRS) was the focus of a high-profile panel discussion at this week's annual meeting of the American Meteorological Society.

The consensus among the panel's meteorologists: VIIRS is opening up exciting new possibilities for weather and climate monitoring.

Commenting on VIIRS' unique day-night band, which enables the capture of highly detailed imagery in extremely low-light conditions, Steve Miller, an atmospheric scientist at Colorado State University's Cooperative Institute for Research in the Atmosphere, said: "VIIRS allows us to use the moon as a surrogate for the sun, providing visibility into nighttime weather and atmospheric conditions with incredible detail never before possible. This makes it a very powerful asset for operational forecasting."

VIIRS was launched into orbit aboard the Suomi NPP satellite in October 2011. Suomi NPP, a NASA-NOAA joint mission, is the precursor to a series of spacecraft that will make up the NOAA Joint Polar Satellite System, which is intended to provide critical weather and climate data for the next two decades.

Strabala of the University of Wisconsin enumerated the technological improvements encompassed in VIIRS over legacy systems, including increased scan distance and greater consistency in resolution across each image scan.

As the scientific community continues to learn how to optimize its use of the VIIRS data, Strabala indicated one drawback to the system: "We only have one such instrument on orbit."

Jedlovec, SPoRT project lead at NASA Marshall Space Flight Center in Huntsville, Ala., cited the critical role the VIIRS day-night band played in the aftermath of Superstorm Sandy.

"The VIIRS night-time imagery was provided to disaster relief agencies and allowed emergency teams to expedite their response to hurricane-ravaged areas," he said.

"This unprecedented night-time perspective was a huge help to relief organizations trying to measure the scope of impact."

Tuesday, January 8, 2013

El Nino, Climate Change link Unclear

The frequency and volatility of El Nino, a weather pattern that hammers the tropical Pacific Ocean every five years or so, does not seem linked to climate change, said US research.

The study involved scientists measuring the monthly growth of ancient coral fossils found on two tropical Pacific islands to determine what, if any, impact the warming climate had on the weather phenomenon.

By reconstructing temperatures and precipitation over the millenniums, the study compared it to the frequency and intensity of El Nino and found that the latter had indeed become more intense and frequent in the 20th century.

But although the increase was statistically significant and could be linked to climate change, the long historic record provided by the coral fossils allowed the researchers to determine that the El Nino Southern Oscillation (ENSO), has also had large natural variations in past centuries.

Thus, it is not clear that changes seen in recent decades can be linked to climate change caused by rising levels of carbon dioxide, the researchers said.

"The level of ENSO variability we see in the 20th century is not unprecedented," said climatologist Professor Kim Cobb, from the School of Earth and Atmospheric Sciences at the Georgia Institute of Technology.

"But the 20th century does stand out, statistically, as being higher than the fossil coral baseline," she added.

The study was sponsored by the National Science Foundation and published in the journal Science.

Researchers from the Scripps Institution of Oceanography and the University of Minnesota also contributed to the study.

El Nino occurs every two to seven years, when the trade winds that circulate surface water in the tropical Pacific start to weaken.

A mass of warm water builds in the western Pacific and eventually rides over to the eastern side of the ocean, causing a major shift in rainfall, bringing floods and mudslides to usually arid countries in the region.

El Nino is ushered out by a cold phase, La Nina, which usually occurs the following year.

Saturday, December 8, 2012

ESA Mars Express: HRSC Images - Mountains Look Frosty

This computer-generated perspective view of Charitum Montes was created using data obtained from the High-Resolution Stereo Camera (HRSC) on ESA’s Mars Express.

The image shows the large breach in the northern wall of the crater, located near to the uppermost sand dune.

Centred at around 53°S and 334°E, the image has a ground resolution of about 20 m per pixel. The image shows the large breach in the northern wall of the crater, located near to the uppermost sand dune. 

The dusting of carbon dioxide ice is a seasonal feature in this region, which covers the crater floor and the surrounding plains.

CREDIT: ESA/DLR/FU Berlin (G. Neukum)

ESA's Mars Express spacecraft orbiting Mars has snapped wintry-looking pictures of a mountain range on the Red Planet's southern highlands, where ridges and crater floors are dusted with carbon dioxide frost.

The pictures were captured by the high-resolution stereo camera on the European Space Agency's (ESA) Mars Express.

They show part of Charitum Montes, a large group of rugged mountains stretching over nearly 620 miles (1,000 kilometers) near the southernmost rim of the Argyre impact basin. The brighter features represent a seasonal layer of carbon dioxide frost.

The images, which were obtained on June 18, show that the mountainous region is pockmarked with many large craters, which have been largely filled in with thick sedimentary deposits.

Annotated image of Charitum Montes.

Credits: ESA/DLR/FU Berlin


This colour-coded overhead view is based on an ESA Mars Express HRSC digital terrain model of the region, from which the topography of the landscape can be derived. 

The colour coding shows the very edge of the Charitum Montes mountain region at the top of the image, with the highest elevation, while the subtle pedestal craters that dot the image almost fade away with just a small amount of relief difference between the elevated ejecta and the surrounding area. 

Credits: ESA/DLR/FU Berlin (G. Neukum)

Wednesday, December 5, 2012

NASA ISS Image: Super Typhoon Bopha

Image credit: NASA

This still image of Super Typhoon Bopha was taken by Expedition 34 Commander Kevin Ford from the International Space Station, as the storm bore down on the Philippines with winds of 135 miles per hour.

Parts of the ISS, orbital outpost, are seen in the picture -- the Permanent Multipurpose Module on the left, and Mini-Research Module 1 on the right.

Friday, November 23, 2012

NASA GEOS-5 Image: Global Atmospheric Aerosols

Image courtesy NASA Goddard Space Flight Center.

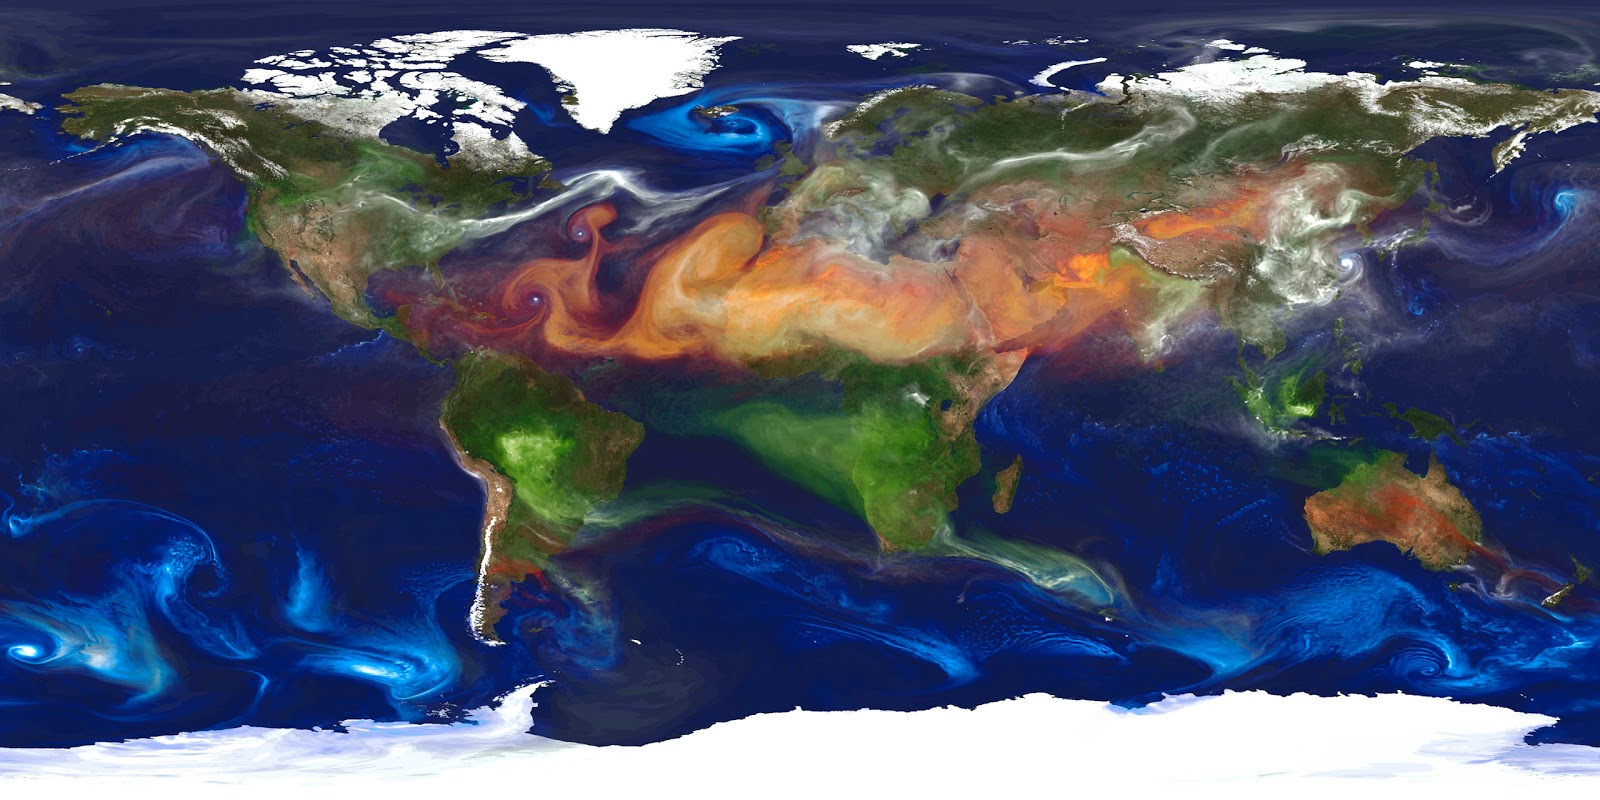
High-resolution global atmospheric modeling run on the Discover supercomputer at the NASA Center for Climate Simulation at Goddard Space Flight Center, provides a unique tool to study the role of weather in Earth’s climate system.

The Goddard Earth Observing System Model, Version 5 (GEOS-5) is capable of simulating worldwide weather at resolutions of 10 to 3.5 kilometers (km).

This portrait of global aerosols was produced by a GEOS-5 simulation at a 10-kilometer resolution. Dust (red) is lifted from the surface, sea salt (blue) swirls inside cyclones, smoke (green) rises from fires, and sulfate particles (white) stream from volcanoes and fossil fuel emissions.