Showing posts with label global. Show all posts

Monday, October 6, 2014

ISRO's MOM and ESA's Rosetta: Global 3-D Mars image

Mars 3-D anaglyph (color) taken by ESA’s Rosetta spacecraft during Mars flyby on 24 February 2007 from a distance of about 240,000 km. 

Image resolution is about 5 km. 

Credit: MPS for OSIRIS Team MPS /UPD /LAM / IAA/ RSSD/ INTA/ UPM/ DASP/ IDA

Here's another breathtakingly glorious view from India's Mars Orbiter Mission (MOM), her first global 3-D portrait of her new home careening around the Red Planet.

MOM is India's first deep space voyager to explore beyond the confines of her home planet's influence and just successfully arrived at the Red Planet after the "history creating" orbital insertion maneuver on Sept. 23/24 following a ten month journey.

This newly released 3-D view from MOM expands upon the initial 2-D global color view of Mars released by the Indian Space Research Organization (ISRO), India's space agency.

The 3-D image was generated from multiple pictures acquired by MOM's on-board Mars Colour Camera on Sept 28, 2014, from the very high altitude of approximately 74,500 kilometers as the spacecraft orbits Mars.

The images were taken by the tri-colour camera as MOM swooped around the Red Planet in a highly elliptical orbit whose nearest point to Mars (periapsis) is at 421.7 km and farthest point (apoapsis) at 76,993.6 km, according to ISRO.

Therefore, the 3-D Red Planet portrait was captured nearly at apoapsis, and being three dimensional, it gives a stereo sense of the huge dust storm swirling over a large swath of the planet's Northern Hemisphere set against the blackness of space.

Below right is the southern polar ice cap. To see the 3-D effect, whip out your handy pair of left-eye red, right-eye blue colour anaglyph glasses.

Mars 3-D anaglyph (black & white) taken by ESA’s Rosetta spacecraft during Mars flyby on 24 February 2007 from a distance of about 240,000 km. Image resolution is about 5 km. 

Credit: MPS for OSIRIS Team MPS /UPD /LAM / IAA/ RSSD/ INTA/ UPM/ DASP/ IDA

It's also worth noting that another of humanity's ground breaking probes currently making news, ESA's comet hunting Rosetta probe, likewise snapped a glorious 3-D view of Mars way back in 2007, during the brief, but critical, gravity assist slingshot maneuver that flung Rosetta along her vast 10 year path through interplanetary space.

So by way of comparison let's take a trip down memory lane and be sure to look back at Rosetta's global 3-D Martian views (below) taken by the high resolution OSIRIS camera on 24 February 2007 at 19:28 CET from a distance of about 240,000 kilometers.

Tuesday, May 6, 2014

Randolph Glacier Inventory (RGI): First globally complete glacier inventory

This image shows the Zhadang glacier south of lake Nam Tso on the nortern ridge of the Nyainqentanglha mountain range (Tibet). 

Credit: Tino Pieczonka (TU Dresden)

For the first time ever, we have a complete inventory of all the glaciers on Earth.

Now we know how many glaciers there are, where they are, and what their extents and volumes are.

The now available digital outlines allow for the first time reliable calculations of the glaciers' future development and hence their contributions to regional hydrology and global sea-level rise.

Thanks to the efforts of an international group of scientists, one of them is Tobias Bolch from Technische Universität Dresden, Germany, who have mapped all of the world's glaciers, glaciologists can now study with unprecedented accuracy the impacts of a changing climate on glaciers worldwide, and determine their total extent and volume on a glacier-by-glacier basis.

Nyainqentanglha mountain range
Overall, glaciers cover an area of about 730,000 km2 and have a volume of about 170,000 km3.

The scientists found nearly 200,000 of them, but they say that this is the least important result of the mapping exercise as the number constantly changes due to disappearing small and fragmenting larger glaciers.

More importantly, each glacier in the new inventory is represented by a computer-readable outline, making precise modelling of glacier–climate interactions much easier.

Graham Cogley
"This boost to the infrastructure means that people can now do research that they simply couldn't do properly before", said Graham Cogley of Trent University, one of the coordinators of the new Randolph Glacier Inventory (RGI), which is named after one of the group's meeting places in New Hampshire.

The now published article is presenting the RGI and first statistical analysis of the global glacier distribution.

The main stimulus for completing the inventory was the recently-published Fifth Assessment of the Intergovernmental Panel on Climate Change (IPCC). Several studies that relied on earlier versions of the RGI were essential sources for that assessment.

Tad Pfeffer
"I don't think anyone could have made meaningful progress on projecting glacier changes if the Randolph inventory had not been available", said the University of Colorado's Tad Pfeffer, lead author of the study just published in the Journal of Glaciology.

Like several of his co-authors, Tad Pfeffer was also involved in the IPCC assessment.

More information: Pfeffer, W.T., Arendt, A. A., Bliss, A., Bolch, T., Cogley, J. G., Gardner, A. S., Hagen, J.-O., Hock, R., Kaser, G., Kienholz, C., Miles, E. S., Moholdt, G., Mölg, N., Paul, F., Radic, V., Rastner, P., Raup, B. H., Rich, J., Sharp, M. J. and the Randolph Consortium: The Randolph Glacier Inventory (2014): a globally complete inventory of glaciers. Journal of Glaciology 60(221), DOI: 10.3189/2014JoG13J176

Thursday, January 16, 2014

Oppressive China's HVT-2: Domination of Space and Earth Orbit

An artist's rendering provided by the Defense Advanced Research Projects Agency (DARPA), on April 23, 2012 shows the Hypersonic Technology Vehicle (HVT-2) which failed just minutes into a test flight in 2011

China for the first time has tested a hypersonic missile vehicle designed to travel several times the speed of sound, the Pentagon said Wednesday.

The test makes China the second country after the United States to conduct experimental flights with hypersonic vehicles, a technology that could allow armies to rapidly strike distant targets anywhere around the globe.

"We're aware of the test of the hypersonic vehicle but we are not commenting on it," said Lieutenant Colonel Jeff Pool, a Pentagon spokesman.

The flight was conducted on January 9 and the Chinese vehicle, dubbed the WU-14, is supposed to travel at Mach 10, or 10 times the speed of sound, according to a report in The Washington Free Beacon, an online publication.

Falcon Hypersonic Technology Vehicle 2 (HTV-2), (AFP Photo / Defense Advanced Research Projects Agency DARPA).

Chinese state-run broadcaster China Radio International quoted the defense ministry information office as saying: "China's planned domestic scientific research and experiments are normal and are not aimed at any country or target."

China refused to explicitly confirm or deny the test.

In its annual report on the Chinese military, the Pentagon made no mention of hypersonic test flights but did say the Chinese had built a hypersonic wind tunnel for experiments.

China's surging economic power has been matched by increasing military might, including investments in an aircraft carrier, anti-ship ballistic missiles, satellites and other hardware.

Three Republican lawmakers, including the House Armed Services Committee Chairman Howard "Buck" McKeon, expressed concern over the test of what they called a "Chinese hypersonic cruise missile" and said the US military was falling behind.

"While round after round of defense cuts have knocked America's technological advantage on its back, the Chinese and other competitor nations push toward military parity with the United States; in some cases, as in this one, they appear to be leaping ahead of us," they said.

"This situation does nothing to support peaceful coexistence in the Pacific," added the statement, also signed by Representatives Randy Forbes and Mike Rogers.

The United States has placed a high priority on hypersonic projects, spending $200 million in fiscal year 2013 on three programs while conducting a number of test flights with hypersonic vehicles.

Thursday, May 16, 2013

NASA Cassini Describes first global topographic map of Titan

These polar maps show the first global, topographic mapping of Saturn's moon Titan, using data from NASA's Cassini mission. 

To create these maps, scientists employed a mathematical process called splining, which uses smooth curved surfaces to "join" the areas between grids of existing topography profiles obtained by Cassini's radar instrument.

Image credit: NASA/JPL-Caltech/ASI/JHUAPL/Cornell/Weizmann

Scientists have created the first global topographic map of Saturn's moon Titan, giving researchers a valuable tool for learning more about one of the most Earth-like and interesting worlds in the solar system.

The map was just published as part of a paper in the journal Icarus.

Titan is Saturn's largest moon - at 1,600 miles (2,574 kilometers) across it's bigger than planet Mercury - and is the second-largest moon in the solar system.

Scientists have an affinity with Titan because it's the only moon in the solar system known to have clouds, surface liquids and a mysterious, thick atmosphere.

The cold atmosphere is mostly nitrogen, like Earth's, but the organic compound methane on Titan acts the way water vapor does on Earth, forming clouds and falling as rain and carving the surface with rivers.

Organic chemicals, derived from methane, are present in Titan's atmosphere, lakes and rivers and may offer clues about the origins of life.

Ralph Lorenz
"Titan has so much interesting activity - like flowing liquids and moving sand dunes - but to understand these processes it's useful to know how the terrain slopes," said Ralph Lorenz, a member of the Cassini radar team based at the Johns Hopkins University Applied Physics Laboratory, Laurel, Md., who led the map-design team.

"It's especially helpful to those studying hydrology and modeling Titan's climate and weather, who need to know whether there is high ground or low ground driving their models."

Titan's thick haze scatters light in ways that make it very hard for remote cameras to "see" landscape shapes and shadows, the usual approach to measuring topography on planetary bodies.

Virtually all the data we have on Titan comes from NASA's Saturn-orbiting Cassini spacecraft, which has flown past the moon nearly 100 times over the past decade.

On many of those flybys, Cassini has used a radar imager, which can peer through the haze, and the radar data can be used to estimate the surface height.

To create the first global, topographic map of Saturn's moon Titan, scientists analyzed data from NASA's Cassini spacecraft and a mathematical process called splining. 

This method effectively uses smooth curved surfaces to "join" the areas between grids of existing topography profiles obtained by Cassini's radar instrument. 

In the upper panel of this graphic, gold colours show where radar images have been obtained over almost half of Titan's surface. 

Image credit: NASA /JPL-Caltech /ASI /JHUAPL /Cornell/Weizmann

Steve Wall
"With this new topographic map, one of the most fascinating and dynamic worlds in our solar system now pops out in 3-D," said Steve Wall, the deputy team lead of Cassini's radar team, based at NASA's Jet Propulsion Laboratory in Pasadena, Calif.

"On Earth, rivers, volcanoes and even weather are closely related to heights of surfaces - we're now eager to see what we can learn from them on Titan."

There are challenges, however. "Cassini isn't orbiting Titan," Lorenz said.

"We have only imaged about half of Titan's surface, and multiple 'looks' or special observations are needed to estimate the surface heights. If you divided Titan into 1-degree by 1-degree [latitude and longitude] squares, only 11 percent of those squares have topography data in them."

Lorenz's team used a mathematical process called splining - effectively using smooth, curved surfaces to "join" the areas between grids of existing data.

"You can take a spot where there is no data, look how close it is to the nearest data, and use various approaches of averaging and estimating to calculate your best guess," he said.

"If you pick a point, and all the nearby points are high altitude, you'd need a special reason for thinking that point would be lower. We're mathematically papering over the gaps in our coverage."

More information: 
The map, as well as a paper on the project ("A Global Topography Map of Titan"), appear in the journal Icarus and are available online at: www.sciencedirect.com/science/article/pii/S0019103513001620

Friday, November 23, 2012

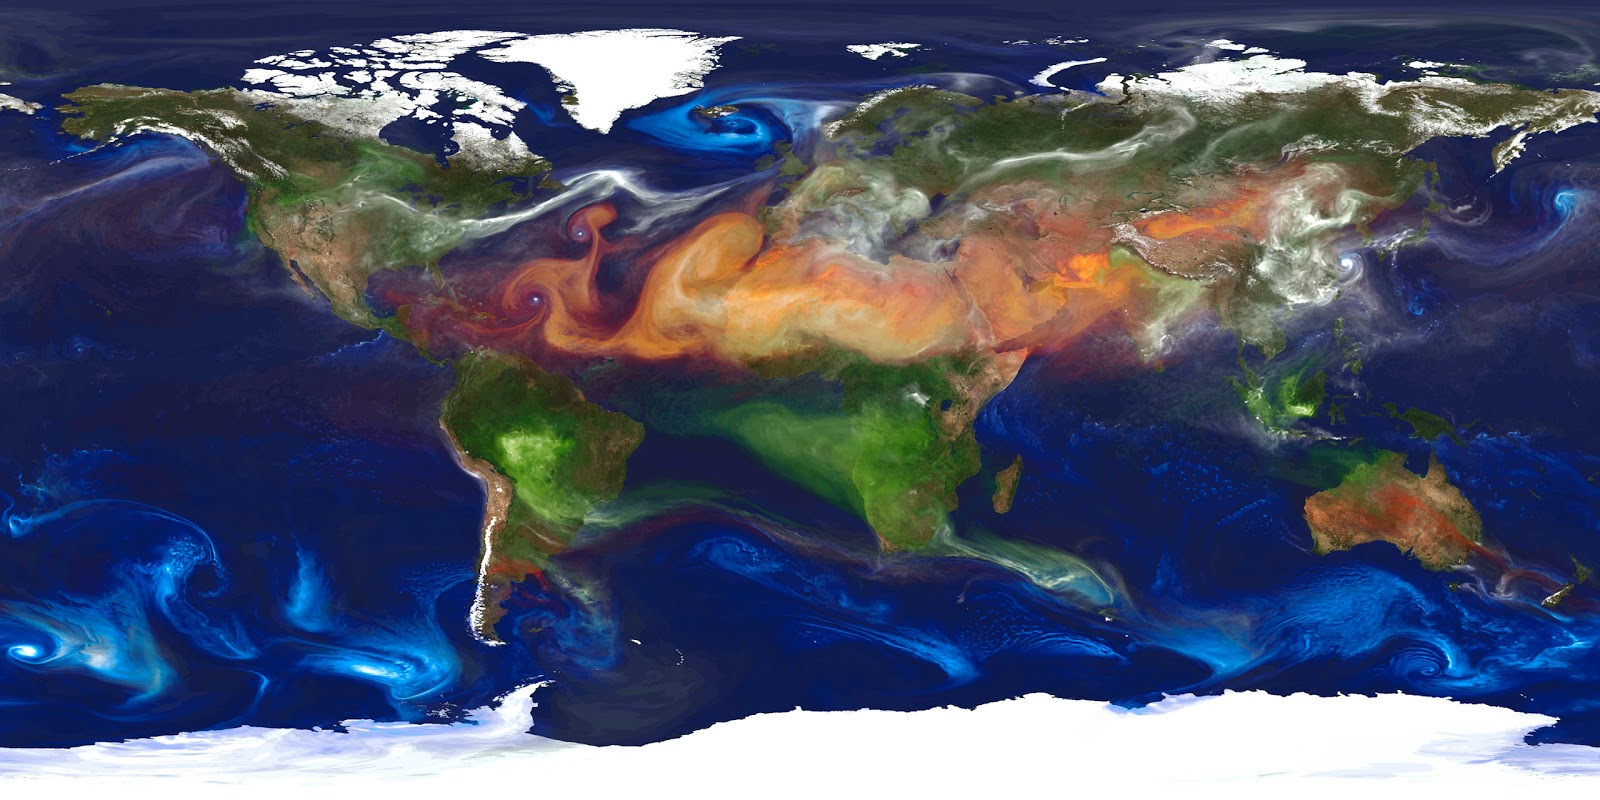
NASA GEOS-5 Image: Global Atmospheric Aerosols

Image courtesy NASA Goddard Space Flight Center.

High-resolution global atmospheric modeling run on the Discover supercomputer at the NASA Center for Climate Simulation at Goddard Space Flight Center, provides a unique tool to study the role of weather in Earth’s climate system.

The Goddard Earth Observing System Model, Version 5 (GEOS-5) is capable of simulating worldwide weather at resolutions of 10 to 3.5 kilometers (km).

This portrait of global aerosols was produced by a GEOS-5 simulation at a 10-kilometer resolution. Dust (red) is lifted from the surface, sea salt (blue) swirls inside cyclones, smoke (green) rises from fires, and sulfate particles (white) stream from volcanoes and fossil fuel emissions.

Monday, June 18, 2012

NASA Maps Global View of Health-Sapping Air Pollution

In many developing countries, the absence of surface-based air pollution sensors makes it difficult, and in some cases impossible, to get even a rough estimate of the abundance of a subcategory of airborne particles that epidemiologists suspect contributes to millions of premature deaths each year.

The problematic particles, called fine particulate matter (PM2.5), are 2.5 micrometers or less in diameter, about a tenth the fraction of human hair. These small particles can get past the body’s normal defenses and penetrate deep into the lungs.

To fill in these gaps in surface-based PM2.5 measurements, experts look toward satellites to provide a global perspective.

Yet, satellite instruments have generally struggled to achieve accurate measurements of the particles in near-surface air.

The problem: Most satellite instruments can't distinguish particles close to the ground from those high in the atmosphere.

In addition, clouds tend to obscure the view and bright land surfaces, such as snow, desert sand, and those found in certain urban areas can mar measurements.

However, the view got a bit clearer this summer with the publication of the first long-term global map of PM2.5 in a recent issue of Environmental Health Perspectives.

Canadian researchers Aaron van Donkelaar and Randall Martin at Dalhousie University, Halifax, Nova Scotia, Canada, created the map by blending total-column aerosol amount measurements from two NASA satellite instruments with information about the vertical distribution of aerosols from a computer model.

Read more of this article here: NASA - Global View of Health-Sapping Air Pollution

Wednesday, June 6, 2012

NASA - 2012 Transit of Venus - Global Map

For Northern Hemisphere locations above latitude ~67° north, all of the transit is visible regardless of the longitude. Northern Canada and all of Alaska will also see the entire event.

Residents of Iceland are in a unique wedge-shaped part of the path (Region X in Figure 1).

They will see both the start and end of the transit but the Sun will set for a short period around greatest transit. A similarly shaped region exists south of Australia (Region Y in Figure 1), but here, the Sun rises after the transit begins and sets before the event ends.

NASA - 2012 Transit of Venus

Transit of Venus 2012: The last time until 2117


Stargazers from across the globe gathered together to watch one of the rarest astronomical spectacles today.

From the U.S. and UK to South Korea, people around the world turned their attention to the daytime sky to make sure they caught the planet Venus passing directly between the sun and Earth - a transit that won't occur again for another 105 years.

The transit of Venus happens in pairs eight years apart - but then with more than a century between cycles.

During the pass, Venus appears as a small, dark round spot moving across the face of the sun, like a bug on a dinner plate.


Tuesday, April 3, 2012

Global observatory sees first light

At 1-metre across, the telescopes of Las Cumbres Observatory in Goleta, California, will be small fry but they will soon be stitched into a global network that will provide researchers with around-the-clock coverage of quickly changing objects such as extrasolar planets, asteroids and supernovae.

On 31 March, the first telescope in the network saw first light, at McDonald Observatory in Fort Davis, Texas, just 60 hours after it was unloaded from the truck.

Eventually, the Las Cumbres Observatory Global Telescope (LCOGT) network will deploy two or three identical 1-metre telescopes, each costing about US$1 million, at observatories in Hawaii, Chile, South Africa, Australia and the Canary Islands. LCOGT also has two 2-metre robotic Faulkes telescopes in Australia and Hawaii.

The philosophy behind the telescopes' design is “don’t be cute, don’t be fancy", says LCOGT scientific director Tim Brown. "Make something you know will work and make a lot of them. Put them out in the field and let them do their thing.”

LCOGT was founded by the computing pioneer Wayne Rosing, a veteran of companies including Apple and Google.

Rosing was also an amateur astronomer, and would help other amateurs to customize their hardware and software. Eventually, he decided he wanted to make a more serious contribution to astronomy.

Rosing cashed in his stake in Google, and gave tens of millions of dollars to the LCOGT project. “I was employee number 6, back in 2006,” says Brown. “We’ve expanded to 60 these days.”

Remote control
The LCOGT team wanted to design a telescope that astronomers would never have to visit. The telescope mount is compact, making it easier to drive with robust mechanical systems.

Every telescope is made from the same components and none of them need to be cooled with liquid nitrogen, which would have required occasional replenishing.

Brown hopes that astronomers will be able to control the network remotely, with one telescope handing over to the next so that the object under study is always in view.

Even though it uses small telescopes, this sort of work can have a big pay-offs. Astronomy has shifted towards broad, shallow surveys of the sky that are aimed at detecting unusual events.

After it is completed early next decade, the Large Synoptic Survey Telescope (LSST), for example, will take a snapshot of the entire southern sky every three days.

The LCOGT network is being designed to provide continuous coverage of some of the objects that the LSST reveals.

Brown says that the LCOGT has three priorities: tracking the motion of candidate exoplanets found by NASA's Kepler space telescope; measuring the decay of light from supernovae to help reduce uncertainties in the estimates of dark energy; and pinpointing the trajectories of near-Earth asteroids.

Mike Montgomery, an astronomer at the University of Texas at Austin and the scientific director for the Whole Earth Telescope (WET), welcomes the LCOGT.

The WET, an ad hoc global network of about 25 telescopes, has since 1986 been pursuing one or two annual campaigns involving several weeks of observations.

He says that every year he has to come up with a science proposal so that collaborators can apply for time on the small telescopes in the WET network.

Sometimes, there are gaps in coverage. “It’s a headache,” says Montgomery. “Every telescope in the world has a different deadline and a different proposal format.”

Montgomery says that, as a one-stop shop for global observations, the LCOGT will be less bureaucratic.

Because they own the telescopes outright, LCOGT will be able to pursue year-round campaigns on many more objects. “It’s the difference between renting and owning,” Montgomery says.

Wednesday, November 16, 2011

Secure World Foundation Supports Launch of Space Security Index in Europe

The SSI is an annual report on trends and developments related to security and outer space. 

The goal of the Index is to improve transparency with respect to space activities and provide a common, comprehensive knowledge base to support the development of national and international policies that contribute to space security.

Secure World Foundation and the Mission of Canada to the European Union partnered to organize the 2011 Space Security Index Launch in Europe. 

The event was held November 3 in Brussels, Belgium, and was part of Secure World Foundation's Brussels Space Policy Round Table.

Last week's gathering convened leading authorities from Canada, the European Union, the European Space Agency, the Non-Proliferation and Disarmament Directorate of the European External Action Service, as well as the European Satellite Operators Association and the Societe europeenne des satellites (SES).

The open discussion took place at the French Chamber of Commerce and Industry in Brussels.

"Space security is not a topic often discussed in Brussels, thus it was very pertinent to launch the 2011 Space Security Index here," said Agnieszka Lukaszczyk, Secure World Foundation (SWF) European Program Manager, moderator of the round table dialogue, assisted by SWF's Natassa Antoniou.

"Europe needs to be involved in the outer space security discussion and this event facilitated exactly that need," Lukaszczyk. She added that SWF will continue to engage European actors in the space security debate among a host of relevant outer space topics.

Sustainability of outer space
Discussions at the space policy round table focused on significant global activities within outer space, with a particular emphasis on Europe, driven by a number of important occurrences in the space sector. The event centered on the issuing of the 2011 Space Security Index (SSI).

"The Space Security Index has steadily grown in sophistication, and has become a trusted source of information on the activities that may have an impact on the sustainability of outer space," said Cesar Jaramillo, Program Officer, Space Security and Nuclear Disarmament for Project Ploughshares, headquartered in Waterloo, Ontario, Canada.

Jaramillo said that the launching of the 2011 edition of the SSI in Brussels "is a testament to the active and relevant role that Europe is playing in current space security discussions."

Sunday, October 23, 2011

NASA Animation: Global Fire Observations and MODIS NDVI


This visualization leads viewers on a narrated global tour of fire detections beginning in July 2002 and ending July 2011.

The visualization also includes vegetation and snow cover data to show how fires respond to seasonal changes.

The tour begins in Australia in 2002 by showing a network of massive grassland fires spreading across interior Australia as well as the greener Eucalyptus forests in the northern and eastern part of the continent.

The tour then shifts to Asia where large numbers of agricultural fires are visible first in China in June 2004, then across a huge swath of Europe and western Russia in August, and then across India and Southeast Asia through the early part of 2005.

It moves next to Africa, the continent that has more abundant burning than any other. MODIS observations have shown that some 70 percent of the world's fires occur in Africa alone.

In what's a fairly average burning season, the visualization shows a huge outbreak of savanna fires during the dry season in Central Africa in July, August, and September of 2006, driven mainly by agricultural activities but also by the fact that the region experiences more lightning than anywhere else in the world.

The tour shifts next to South America where a steady flickering of fire is visible across much of the Amazon rainforest with peaks of activity in September and November of 2009.

Almost all of the fires in the Amazon are the direct result of human activity, including slash-and-burn agriculture, because the high moisture levels in the region prevent inhibit natural fires from occurring.

It concludes in North America, a region where fires are comparatively rare. North American fires make up just 2 percent of the world's burned area each year.

The fires that receive the most attention in the United States, the uncontrolled forest fires in the West, are less visible than the wave of agricultural fires prominent in the Southeast and along the Mississippi River Valley, but some of the large wildfires that struck Texas earlier this spring are visible.

More information on the Fire Information for Resource Management (FIRMS) is available at http://maps.geog.umd.edu/firms/

Wednesday, August 24, 2011

NASA MARS: Daybreak at Gale Crater - Rover Curiosity's Landing Site

This computer-generated images depicts part of Mars at the boundary between darkness and daylight, with an area including Gale Crater, beginning to catch morning light.

Northward is to the left. Gale is the crater with a mound inside it near the center of the image. NASA selected Gale Crater as the landing site for Curiosity, the Mars Science Laboratory.

The mission's rover will be placed on the ground in a northern portion of Gale crater in August 2012.

Gale Crater is 96 miles (154 kilometers) in diameter and holds a layered mountain rising about 3 miles (5 kilometers) above the crater floor. The intended landing site is at 4.5 degrees south latitude, 137.4 degrees east longitude.

This view was created using three-dimensional information from the Mars Orbiter Laser Altimeter, which flew on NASA's Mars Global Surveyor orbiter. The vertical dimension is not exaggerated. Colour information is based on general Mars color characteristics.

Image Credit: NASA/JPL-Caltech

Thursday, June 17, 2010

ESA Columbus & ISS Keeps Watch On World's Sea Traffic


ISS Keeps Watch On World's Sea Traffic

As the ISS circles Earth, it has begun tracking individual ships crossing the seas beneath. An experiment hosted by ESA's Columbus module is testing the viability of monitoring global traffic from the Station's orbit hundreds of kilometres up.

The ship-detection system under test is based around the Automatic Identification System (AIS), the marine equivalent of the air traffic control system.

All international vessels, cargo ships above certain weights and passenger carriers of all sizes must carry 'Class A' AIS transponders, broadcasting continually updated identification and navigation data.

AIS allows port authorities and coastguards to track seagoing traffic, but the system relies on VHF radio signals with a horizontal range of just 40 nautical miles (74 km). This makes it useful within coastal zones and on a ship-to-ship basis but open ocean traffic remains largely untracked. However, AIS signals travel much further vertically - all the way up to the International Space Station.

Global overview of maritime traffic
"The COLAIS (Columbus AIS) experiment was switched on at the start of June," said Karsten Strauch, ESA's project manager.

"To give an idea, more than 90 000 Class A AIS messages were gathered between 19:00 GMT on 2 June and 09:00 GMT the following day, giving a global overview of maritime traffic."

With commissioning completed, the experiment is run remotely and the results are routed via the Columbus Control Centre in Oberpfaffenhofen, Germany to COLAIS teams.

"We are currently testing the NORAIS receiver, built by the Norwegian Defence Research Establishment and Kongsberg Seatex," explained Mr Strauch.

"In three months' time the Station crew will switch it with a second receiver called LUXAIS, the work of Luxembourg companies Luxspace and Emtronix. For the next two years we will go on swapping between these receivers."

The Station's orbit crosses all major shipping lanes. The main challenge is simply that far too many vessels are detected at once, leading to signal overlaps and interference. The Station's 7 km/s speed also distorts the signal. The receivers therefore need to be capable of high-performance signal detection and message decoding.

Being hosted on the ISS, COLAIS can be kept updated in the future simply by astronauts swapping receivers, or fixing any problems that arise.

Integrating AIS information with other satellite data, such as from remote-sensing satellites, should significantly improve maritime surveillance and boost safety and security at sea.

ESA is planning a dedicated initiative in this area as part of its Advanced Research in Telecommunications Systems (ARTES) programme.

Sunday, February 21, 2010

Friday, February 19, 2010

NASA Analysis: Road Transportation is Key Driver of Climate Warming

The on-road transportation sector releases significant amounts of carbon dioxide, black carbon, and ozone—all substances that cause warming.

In contrast, the industrial sector releases many of the same gases, but it also tends to emit sulfates and other aerosols that cause cooling by reflecting light and altering clouds. Credit: NASA GISS/Unger


For decades, climatologists have studied the gases and particles that have potential to alter Earth's climate. They have discovered and described certain airborne chemicals that can trap incoming sunlight and warm the climate, while others cool the planet by blocking the Sun's rays.

Now a new study led by Nadine Unger of NASA's Goddard Institute for Space Studies (GISS) in New York City offers a more intuitive way to understand what's changing the Earth's climate. Rather than analyzing impacts by chemical species, scientists have analyzed the climate impacts by different economic sectors.

Each part of the economy, such as ground transportation or agriculture, emits a unique portfolio of gases and aerosols that affect the climate in different ways and on different timescales.

"We wanted to provide the information in a way that would be more helpful for policy makers," Unger said. "This approach will make it easier to identify sectors for which emission reductions will be most beneficial for climate and those which may produce unintended consequences."

Unger's model finds that in 2020 (left), transportation, household biofuels and animal husbandry will have the greatest warming impact on the climate, while the shipping, biomass burning, and industrial sectors will have a cooling impact.

By 2100 (right), the model finds that the power and industrial sector will become strongly warming as carbon dioxide accumulates. Credit: NASA GISS/Unger


In a paper published online on Feb. 3 by the Proceedings of the National Academy of Sciences, Unger and colleagues described how they used a climate model to estimate the impact of 13 sectors of the economy from 2000 to 2100. They based their calculations on real-world inventories of emissions collected by scientists around the world, and they assumed that those emissions would stay relatively constant in the future.

Unger's analysis is one of the first of its kind to incorporate the multiple effects that aerosol particles can have on clouds, which affect the climate indirectly. Credit: NASA's Johnson Space Center


Monday, January 18, 2010

China Launches Third Orbiter For Indigenous GPS

China took one step forward in its ambition to build an independent global navigation network (GPS) capable of rivaling foreign congeneric systems with the successful launch of a new orbiter into space early Sunday morning.

Boosted by a Long-March-3III carrier rocket into a geostationary orbit from the Xichang Satellite Launch Center, it was the third orbiter China has launched for the network, also known as Beidou, or COMPASS system.

It will join another two already in orbits to form a network which will eventually have a total of 35 satellites, capable of providing global navigation service to users around the world around 2020.

The new orbiter and the carrier rocket were researched and developed by Chinese Aerospace Science and Technology Corporation and Chinese Academy of Carrier Rocket Technology respectively.

The network will have five satellites in geostationary orbit and another 30 in non-geostationary orbits, according to a plan for the COMPASS system.

According to the plan, the system will firstly provide navigation, time signal and short message services in the Asia and Pacific region around 2012.

The COMPASS system will provide both open and authorized services, according to China's satellite navigation project center.

The open service will be free of charge for the system's users within service area with a resolution of 10 meters for positioning, an accuracy of 10 nanosecond for time signal and an accuracy of 0.2 meter per second for speed measurement.

The authorised service will provide more accurate services for authorized users.