Showing posts with label animation. Show all posts

Thursday, February 5, 2015

NASA DAWN: New Images of CERES - Animation

This image is one several images NASA's Dawn spacecraft took on approach to Ceres on Feb. 4, 2015 at a distance of about 90,000 miles (145,000 kilometers) from the dwarf planet. 

Image credit: NASA/JPL-Caltech/UCLA/MPS/DLR/IDA

NASA's Dawn spacecraft, on approach to dwarf planet Ceres, has acquired its latest and closest-yet snapshot of this mysterious world.

The above image of Ceres, taken on Feb. 4, 2015, from a distance of about 90,000 miles (145,000 kilometers).

At a resolution of 8.5 miles (14 kilometers) per pixel, the pictures represent the sharpest images to date of Ceres.

After the spacecraft arrives and enters into orbit around the dwarf planet, it will study the intriguing world in great detail.

Ceres, with a diameter of 590 miles (950 kilometers), is the largest object in the main asteroid belt, located between Mars and Jupiter.


Monday, January 19, 2015

NASA Dawn Spacecraft captures new images of CERES craters

The Dawn spacecraft observed Ceres for an hour on Jan. 13, 2015, from a distance of 238,000 miles (383,000 kilometers). 

A little more than half of its surface was observed at a resolution of 27 pixels. 

This animated GIF shows bright and dark features. 

Image Credit: NASA/JPL-Caltech/UCLA/MPS/DLR/IDA/PSI

Latest image from Nasa's Dawn Spacecraft showing the craters on Ceres.

Credit: NASA

NASA's Dawn spacecraft has entered an approach phase in which it will continue to close in on Ceres, a Texas-sized dwarf planet never before visited by a spacecraft.

Dawn launched in 2007 and is scheduled to enter Ceres orbit in March 2015.

Dawn recently emerged from solar conjunction, in which the spacecraft is on the opposite side of the sun, limiting communication with antennas on Earth.

Now that Dawn can reliably communicate with Earth again, mission controllers have programmed the maneuvers necessary for the next stage of the rendezvous, which they label the Ceres approach phase.

Dawn is currently 400,000 miles (640,000 kilometers) from Ceres, approaching it at around 450 miles per hour (725 kilometers per hour).

The spacecraft's arrival at Ceres will mark the first time that a spacecraft has ever orbited two solar system targets.

Thursday, November 6, 2014

Animation of Star's Protoplanetary Disc - Video


Artists from the European Southern Observatory (ESO) and the National Science Foundation have created impressions of a planet forming disc around a stars.

Best-Ever View of Alien Planet Birth Caught by Giant Radio Telescope


Friday, November 22, 2013

ESA SWARM: Explaining the earth's Magnetic Field - Animation video


An introduction to Earth's magnetic field: what it is, where it comes from and what are the benefits and advantages to life on Earth.

Friday, April 26, 2013

NASA Asteroid Capture Mission Explained - Animation


NASA's 2014 budget poposes a mission to robotically capture a small near-Earth asteroid and bring it into a stable lunar orbit where astronauts can visit and explore it, a 'stepping stone' to future missions to farther asteroids.

Credit: NASA

Monday, April 15, 2013

North Korea's Unha-3 rocket: Analytical Graphics animation - Video


Analytical Graphics, Inc., video animation depicts North Korea's Unha-3 rocket and Kwangmyongsong-3 satellite in the last leg of a potential orbital launch in April 2012.

CREDIT: Analytical Graphics, Inc.

Monday, December 10, 2012

Carl Sagan's Pale Blue Dot, Animated in Motion Graphics


“That’s home. That’s us. On it everyone you love, everyone you know, everyone you ever heard of, every human being who ever was, lived out their lives.”
Over the years, I’ve enjoyed my share of animated adaptations of Carl Sagan’s iconic Pale Blue Dot monologue, based on the seminal photograph of Earth taken by the Voyager 1 spacecraft in 1990. Now comes a lovely motion graphics adaptation by animation studio ORDER — enjoy, and see if you can hold back the chills.

Friday, September 21, 2012

The Science of Procrastination - And How To Manage It - YouTube


From AsapSCIENCE — who have previously brought us the scientific cure for hangovers, the neurobiology of orgasms, and how music enchants the brain — comes this illustrated explication of the science of procrastination and how to manage it, a fine addition to these five perspectives on procrastination.

Among the proposed solutions is the Pomodoro technique, a time-management method similar to timeboxing that uses timed intervals of work and reward.

Human motivation is highly influenced by how imminent the reward is perceived to be — meaning, the further away the reward is, the more you discount its value. This is often referred to as Present bias, or Hyperbolic discounting.

Thursday, August 30, 2012

NASA Mars Curiosity: A desolate vision of the future of Mars exploration


In the wake of Curiosity's landing on Mars, artist Kelly Richardson's depictions of a post-apocalyptic Red Planet are a call for us to save our own planet

IT'S 200 years from now, and the sun beats down on a barren landscape of red rock scattered with smashed satellites and dilapidated robots.

NASA's battered old Curiosity rover lies wedged on a mound of dirt, its wheels whirring intermittently in futile effort, like an exhausted beetle stuck on its back.

This bleak Mars-scape is the work of Canadian artist Kelly Richardson. Mariner 9, a 12-metre long, hyper-realistic video installation, named after a NASA orbiter, offers a glimpse at a possible reality for the future of humanity on other planets.

Richardson worked closely with the High Resolution Imaging Science Experiment at the University of Arizona in Tucson and NASA to make sure elements such as the spacecraft that already exist and the composition of the rocks were accurate and realistic.

Facts couldn't fill in all the details though, and that is where Richardson's imagination took over. "Because it's a futurescape, of course I had to imagine what craft we might produce from this point," she says.

The result is a breathtaking yet peaceful panorama. At first glance, the footage could be mistaken for a photograph.

Movements in the scene are subtle and hypnotic - a gust of sand blows, the shadows shift and the robots whirr. An eerie soundscape accompanies it all.

Alongside the degeneration is construction. Pipes protrude from the ground - although it is open to speculation who or what built them.

That kind of ambiguity is important to Richardson. Take the two pulsing beacons in the middle distance, reminiscent of a landing strip.

"Maybe they're calling to other spacecraft that are on their way, or perhaps they had functioned that way before, or they could be sending data back to whomever, possibly no one," she says.

The idea that there may be nobody home to pick up these signals resonates with Richardson's other works, which often depict post-apocalyptic scenes of Earth's future.

Mariner 9 is suffused with the same concerns for the environment and humanity. "I don't want to depress people, but at the same time it would be great if we all woke up and decided to take charge of the situation," she says.

If we don't, Curiosity's successful landing on Mars could be one more fateful step towards realising this prophecy.

Saturday, August 4, 2012

NASA's MSL as seen from Mars Express during MSL's arrival at Mars - YouTube


Celestia animation based on forecast orbital trajectories of ESA's Mars Express, NASA's Mars Science Laboratory and Mars itself during MSL's entry, descent and landing, set for 6 August 2012.

Sunday, April 29, 2012

NASA Orion Vehicle: Animated video shows spacecraft in orbit

NASA may have pushed back the Orion spacecraft's test flight to 2014, but you can get an early glimpse of the capsule in orbit thanks to this animated video from Full Werks studio.

You'll see the capsule circle the planet before touching down in the Pacific, all with a much better view than you can expect when that actual launch date rolls around.

The animation features audio clips from the original Apollo and, as any NASA-related video worth its salt should, includes a vintage voiceover from space sage Carl Sagan.

Sunday, October 23, 2011

NASA Animation: Global Fire Observations and MODIS NDVI


This visualization leads viewers on a narrated global tour of fire detections beginning in July 2002 and ending July 2011.

The visualization also includes vegetation and snow cover data to show how fires respond to seasonal changes.

The tour begins in Australia in 2002 by showing a network of massive grassland fires spreading across interior Australia as well as the greener Eucalyptus forests in the northern and eastern part of the continent.

The tour then shifts to Asia where large numbers of agricultural fires are visible first in China in June 2004, then across a huge swath of Europe and western Russia in August, and then across India and Southeast Asia through the early part of 2005.

It moves next to Africa, the continent that has more abundant burning than any other. MODIS observations have shown that some 70 percent of the world's fires occur in Africa alone.

In what's a fairly average burning season, the visualization shows a huge outbreak of savanna fires during the dry season in Central Africa in July, August, and September of 2006, driven mainly by agricultural activities but also by the fact that the region experiences more lightning than anywhere else in the world.

The tour shifts next to South America where a steady flickering of fire is visible across much of the Amazon rainforest with peaks of activity in September and November of 2009.

Almost all of the fires in the Amazon are the direct result of human activity, including slash-and-burn agriculture, because the high moisture levels in the region prevent inhibit natural fires from occurring.

It concludes in North America, a region where fires are comparatively rare. North American fires make up just 2 percent of the world's burned area each year.

The fires that receive the most attention in the United States, the uncontrolled forest fires in the West, are less visible than the wave of agricultural fires prominent in the Southeast and along the Mississippi River Valley, but some of the large wildfires that struck Texas earlier this spring are visible.

More information on the Fire Information for Resource Management (FIRMS) is available at http://maps.geog.umd.edu/firms/

Saturday, October 22, 2011

"Space Oddity" Davide Bowie song as an Animated Film


Space Oddity from Andrew Ruttan on Vimeo.

When animator Andrew Ruttan caught sight of Andrew Kolb’s illustrated interpretation of David Bowie’s classic song Space Oddity he immediately knew what he wanted to do.

He emailed Kolb and asked if he could animate his illustrations. Here is the result, so there is no need to tell you that the answer was in the affirmative. I had immense fun wallowing in nostalgia and enjoying this not for profit animated short.

This is such a very cool 'collaboration' of three artists (two Andrews and a David!) working in three different spheres but bringing forth a complete whole.

Of course, Mr Bowie may not be aware of this latest take on his timeless song but I would like to think that he would approve. 

It is still (happily) available on itunes to download so perhaps a whole new generation can now discover the mystique and marvel of Major Tom.

Wednesday, September 7, 2011

ESA: The origin of ultrafast substorm auroras

This animation depicts the sequence of events that give rise to ultrafast substorm auroras.

A magnetic reconnection event occurs far out in the magnetotail, at a distance of around 125 000 - 200 000 km.

Energy from this event is transported by kinetic Alfvén waves (KAW) - which carry electrons - towards Earth at speeds of several thousand kilometres per second.

These KAW can reach Earth quickly enough, and carry sufficient energy, to produce intense auroras.

In reality, the reconnection process is persistent and less bursty, continuously emitting energy via the KAWs to the aurora.

ESA Science & Technology: The origin of ultrafast substorm auroras

Thursday, July 14, 2011

Mars Science Laboratory Curiosity Rover Animation


This 11-minute animation depicts key events of NASA's Mars Science Laboratory mission, which will launch in late 2011 and land a rover, Curiosity, on Mars in August 2012.

Visit NASA Multimedia Gallery here

Thursday, March 17, 2011

Animation of Orbital Insertion of Mercury spacecraft


NASA's MESSENGER mission, launched in 2004, is slated to slide into Mercury's orbit March 17 after a harrowing 4.7 billion mile journey that involved 15 loops around the sun and will bring relief and renewed excitement to the University of Colorado Boulder team that designed and a built an $8.7 million instrument onboard.

"In 2004, this milestone seemed like it was a long, long way away," said Senior Research Associate William McClintock, a mission co-investigator from CU-Boulder's Laboratory for Atmospheric and Space Physics. "But here we are at last, poised to help solve some of the many tantalizing mysteries about Mercury."

The smallest of the solar system's four rocky planets, Mercury is about two-thirds of the way nearer to the sun than Earth and has been visited by only one other spacecraft, NASA's Mariner 10, in 1974 and 1975. CU-Boulder scientists say learning what makes the hot, rocky planet tick will help them better understand the formation and evolution of planetary systems.

The refrigerator-sized spacecraft is carrying seven instruments -- a camera, a magnetometer, an altimeter and four spectrometers. Designed and built by CU-Boulder's LASP, the Mercury Atmospheric and Surface Composition Spectrometer, or MASCS, is a power-packed, 7-pound instrument that will make measurements of Mercury's surface and its tenuous atmosphere, called the exosphere.

MASCS breaks up light like a prism, and since each element and compound has a unique spectral signature, scientists can determine the distribution and abundance of various minerals and gases on the planet's surface and exosphere, said McClintock. "We now know Mercury's exosphere is constantly changing," he said.

During a 2009 MESSENGER flyby of Mercury, MASCS detected magnesium, an element created inside exploding stars, clumped in the exosphere. The team determined magnesium, sodium and potassium and several other kinds of atoms flying off Mercury's surface were being accelerated by solar radiation pressure to form a gigantic tail of material flowing away from the sun, said McClintock.

"All of the instruments on MESSENGER had to be extremely light, which stretched our imaginations and creativity," said LASP's Mark Lankton, program manager for MASCS. "We have learned a lot, and wound up getting a lot of bang for our buck."

LASP Director Daniel Baker, also a co-investigator on the MESSENGER mission, is studying Mercury's magnetic field and its interaction with the solar wind, including violent "sub-storms" that occur in the planet's vicinity. Since Mercury is the closest planet to the sun, MESSENGER is equipped with a large sunshade and heat-resistant ceramic fabric to protect it, said Baker.

"The three successful flybys of MESSENGER past Mercury have already rewritten the textbooks about the sun's nearest neighbor," Baker said. "We are pleased by all we have learned about the space environment of the planet. But we think there is so much more to learn -- we've probably just scratched the surface, so to speak."

Baker said the orbit insertion of Mercury will be celebrated by all of LASP, including a solar science team that saw its $28 million instrument crash into the sea March 4 due to problems with a NASA-contracted launch vehicle. "A very important aspect of LASP is that it is like a big family," Baker said. "Everyone shares the joys of success and the sorrow of failure, which has been a blessedly rare occurrence in our history."

"We have all of our appendages crossed for a successful orbit insertion," said Lankton. "MESSENGER is part of NASA's Discovery Program, and I'd be surprised if we don't continue to be surprised. Once we are in Mercury's orbit we are going to be getting a bounty of new data every day."

Monday, October 4, 2010

Knot In The Ribbon At The Edge Of The Solar System Unties

One of the clear features visible in the IBEX maps is an apparent knot in the ribbon. Scientists were anxious to see how this structure would change with time. 
The second map showed that the knot in the ribbon somehow spread out. It is as if the knot in the knot was literally untangled over only six months.


This visualisation shows a close-up of the ribbon (green and red) superimposed on the stars and constellations in the nighttime sky. The animation begins by looking toward the nose of the heliosphere and then pans up and left to reveal the knot.

The twisted structure superimposed on the map is an artist's conception of the tangled up ribbon. The animation then shows this structure untangling as we fade into the second map of the heliosphere. Credit: IBEX ScienceTeam/Goddard Scientific Visualization Studio/ESA

Researchers believe the ribbon, first revealed in maps produced by NASA's Interstellar Boundary Explorer (IBEX) spacecraft, forms in response to interactions between interstellar space and the heliosphere, the protective bubble in which the Earth and other planets reside. Sensitive neutral atom detectors aboard IBEX produce global maps of this region every six months.

Analyses of the first map, released last fall, suggest the ribbon is somehow ordered by the direction of the local interstellar magnetic field outside the heliosphere, influencing the structure of the heliosphere more than researchers had previously believed.

The knot feature seen in the northern portion of the ribbon in the first map stood apart from the rest of the ribbon as the brightest feature at higher energies.

While the second map, released publicly with the just-published paper, shows the large-scale structure of the ribbon to be generally stable within the six-month period, changes are also apparent. The polar regions of the ribbon display lower emissions and the knot diminishes by as much as a third and appears to "untie" as it spreads out to both lower and higher latitudes.

"What we're seeing is the knot pull apart as it spreads across a region of the ribbon," says Dr. David J. McComas, IBEX principal investigator and an assistant vice president at Southwest Research Institute in San Antonio.

"To this day the science team can't agree on exactly what causes the knot or the ribbon, but by comparing different sky maps we find the surprising result that the region is changing over relatively short time periods. Now we have to figure out why."


More.....

Friday, March 5, 2010

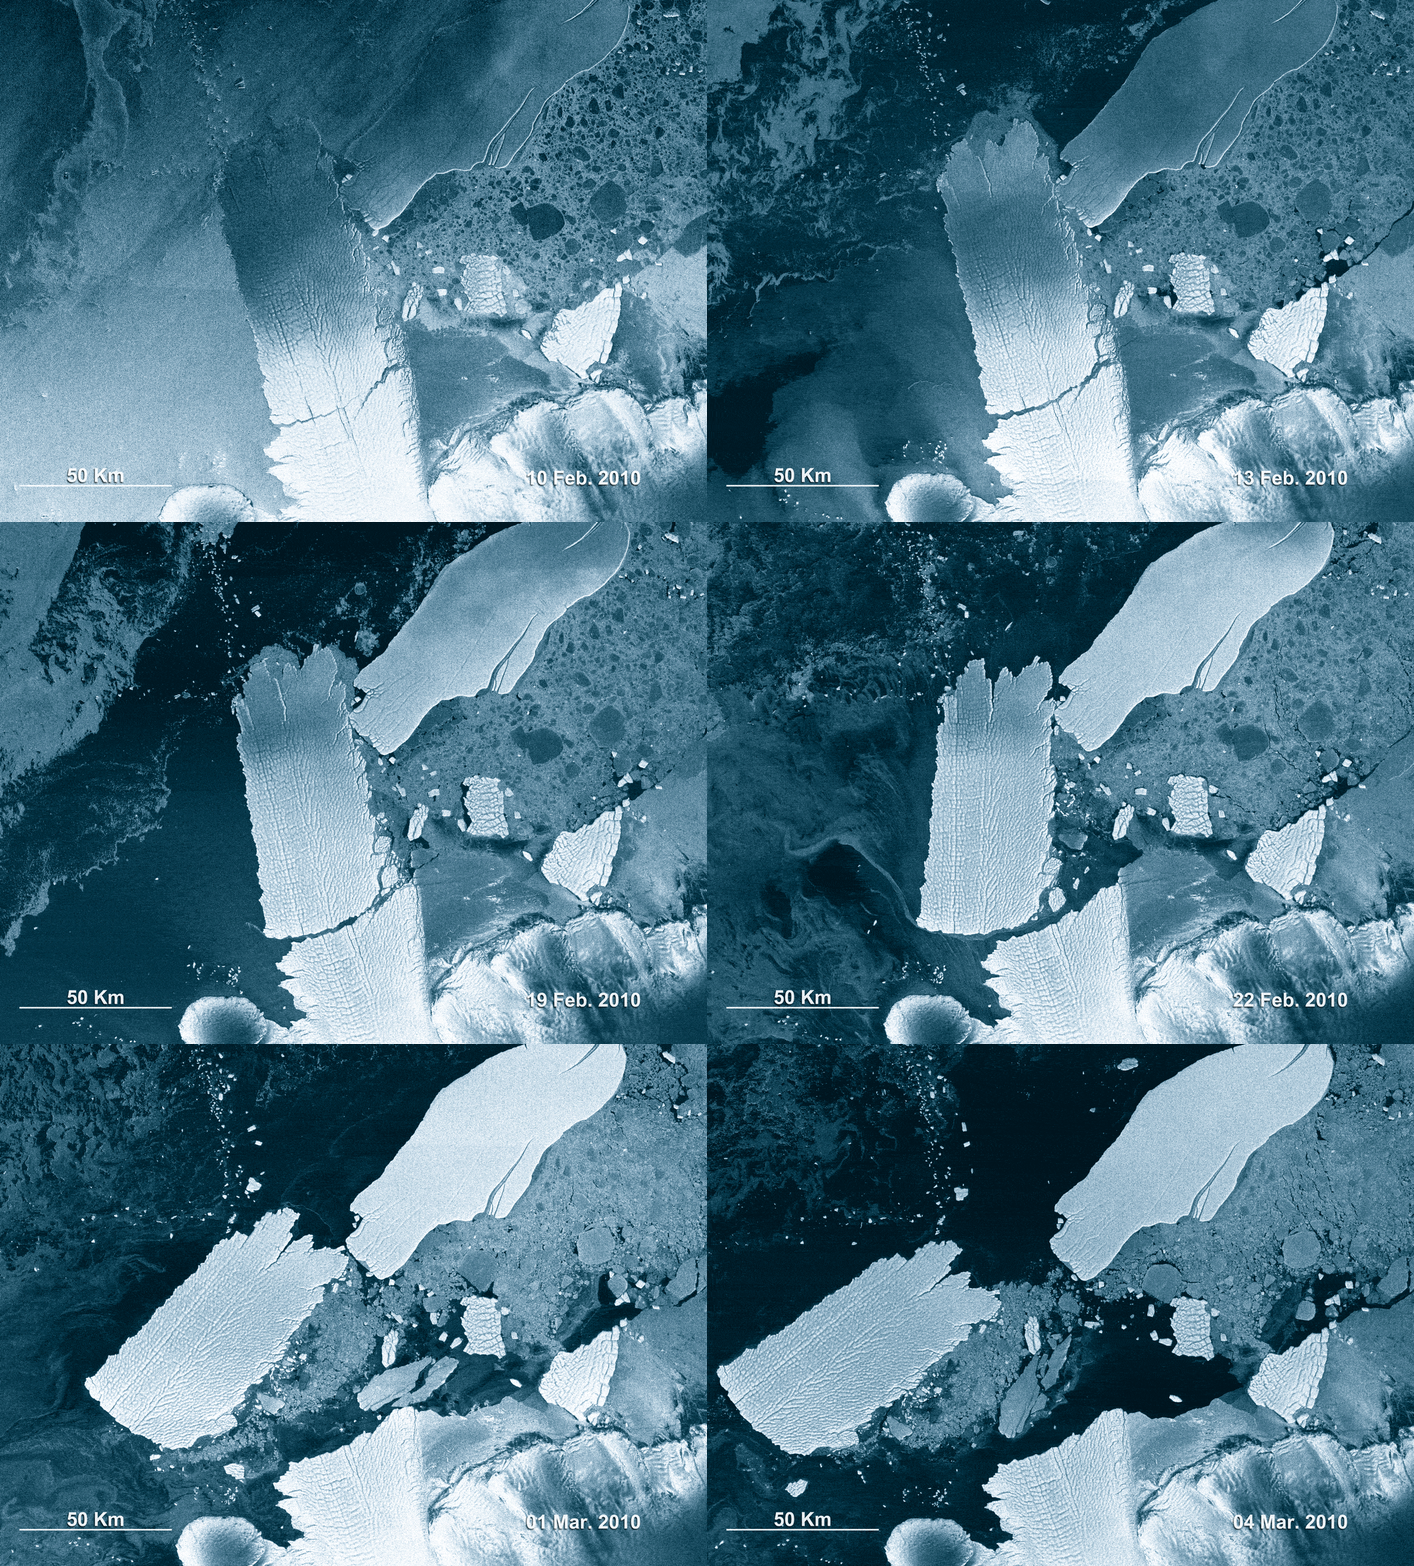
ESA ENVISAT: Animation of Antartica Mertz Glacier Breaking up


Click on the picture to run the animation

This animation, made up of eight Envisat radar images, shows the 97-km long B-9B iceberg (right) ramming into the Mertz Glacier Tongue in Eastern Antarctica in early February 2010.

The collision caused a chunk of the glacier’s tongue to snap off, giving birth to another iceberg nearly as large as B-9B. The new iceberg, named C-28, is roughly 78-km long and 39-km wide, with a surface area of 2500 sq km (the size of Luxembourg).

Envisat’s Advanced Synthetic Aperture Radar (ASAR) acquired these images from 10 February to 4 March in Wide Swath Mode, providing spatial resolution of 150 m. ASAR can pierce through clouds and local darkness and is capable of differentiating between different types of ice.

Credits: ESA

Saturday, January 23, 2010