Showing posts with label Earth Observation. Show all posts

Tuesday, December 16, 2014

ESA Radar Scans: Ground displacement in Bucharest, Romania

Satellite radar scans show various points on and around the Palace of Parliament in Romania’s capital, Bucharest,  that are rising (blue) and sinking (red/orange) from 2011–14.

The radar data were processed using Persistent Scatterer Interferometry (PSI), a technique that can help detect and monitor movements over wide areas with high sensitivity.

It typically works best with hard structures such as buildings, roads or railways, and can trace weak spots in such structures.

This image was produced by the Advanced Studies and Research Center, a Romanian company that processes and interprets optical and radar satellite date for public and private clients across the globe.

The company has recently been validated by ESA’s Terrafirma project as a PSI service provider.

Thursday, September 25, 2014

ISS Giant Earth Observation Satellite

Astronauts aboard the International Space Station (ISS) photographed this striking view of Pavlof Volcano on May 18, 2013. 

The oblique perspective from the ISS reveals the three dimensional structure of the ash plume, which is often obscured by the top-down view of most remote sensing satellites.

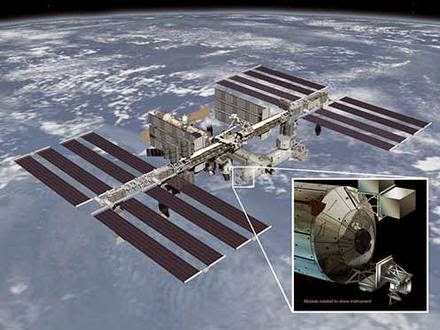
The International Space Station has been called a stepping stone to other worlds.

NASA hasn't forgotten, however, that the behemoth space station is also on the doorstep of Earth.

"We're seeing the space station come into its own as an Earth-observing platform," says Julie Robinson, chief scientist for the International Space Station Program.

"It has a different orbit than other Earth-observing satellites. It's closer to Earth, and it sees Earth at different times of day with a different schedule."

In short, the space station offers something unique to the study of our home planet.

Sometimes astronauts in low Earth orbit to see what regular satellites do not. In May 2013 for example, astronauts on board the International Space Station photographed a fresh eruption of the Pavlof Volcano in the Aleutian Islands.

Their oblique perspective revealed the three dimensional structure of the ash plume, which was only 20,000 feet high, but many times longer. Down-looking satellites could not get the same kind of 3D information.

Low Earth orbit turns out to be a great place to study the planet below. In recent years astronauts trained to photograph Earth have gathered data on desert dust, coral reefs, urban growth, pollution, glaciers, hurricanes, lightning, river deltas, volcanic plumes, Northern and Southern Lights and much more.

Now, however, NASA is taking the space station's Earth-observing capabilities to a whole new level.

Before the end of the decade, six NASA Earth science instruments will be mounted to the station to help scientists study our changing planet.

The upgrades began this month: On Sept. 20th, a SpaceX resupply rocket blasted off from Cape Canaveral carrying the first NASA Earth-observing instrument to be mounted on the exterior of the space station: ISS-RapidScat will monitor ocean winds for climate research, weather predictions and hurricane science.

Next up is the Cloud-Aerosol Transport System (CATS) a laser radar that can measure clouds along with airborne particles such as pollution, mineral dust, and smoke. CATS will follow ISS-RapidScat on another SpaceX flight targeted for December.

Two more Earth science instruments are slated to launch in 2016.

First, SAGE III will measure ozone and other gases in the upper atmosphere to help scientists assess how the ozone layer is recovering.

Second, the Lightning Imaging Sensor will monitor thunderstorm activity around the globe.

Those instruments are already built and ready to fly. In July, NASA selected proposals for two new instruments: The Global Ecosystem Dynamics Investigation (GEDI), and the ECOsystem Spaceborne Thermal Radiometer Experiment on Space Station (ECOSTRESS), will give scientists new ways to observe how forests and ecosystems are affected by climate change. Both will be completed before the end of the decade.

Friday, September 19, 2014

ESA Earth Observation Image: JAXA ALOS satellite views Helsinki

This image acquired by Japan’s ALOS satellite on 28 June 2009 shows Finland’s capital and largest city, Helsinki (upper right), on the shores of the Gulf of Finland.

The gulf is the eastern arm of the Baltic sea, stretching all the way to St Petersburg in Russia.

The waters are relatively shallow, with an average depth of about 38 m and maximum depth of about 100 m.

During winter, usually in January, the waters freeze and stay frozen until about April.

Satellites play an important role during this season for shipping, providing imagery that helps icebreaker boats navigate through these frozen waters.

Situated on the tip of a peninsula and on more than 300 islands, Helsinki is sparsely populated compared to other European capitals and has many green areas.

Running north to south through the centre of the city is a 10 km-long forested park that offers opportunities for outdoor sports and activities to Helsinki’s residents.

This year, the park celebrates its 100-year anniversary, marked by various activities including nature walks, a photo competition and other events.

North of the city we can see the runways of the Helsinki airport, while farther west, the large, dark green area of Nuuksio National Park is evident.

The image is featured on the Earth from Space video programme.


Wednesday, September 10, 2014

Scientists concerned over the future of satellite-based research

Landsat 8 captured fine details of the lava flowing in Iceland between the Bardarbunga and Askja volcanoes.

Credit: NASANOAA.

The U.S. has more than 30 civilian, Earth-observing satellites circling the planet, providing scientists with a torrent of crucial environmental and climate information.

More satellites are on deck to launch in the next few years, but, according to an article in Chemical & Engineering News (C&EN), the weekly news magazine of the American Chemical Society, scientists have registered serious concerns over the lack of a long-term, cohesive vision for the scientific missions.

Jyllian Kemsley, a senior editor at C&EN, reports that satellites are marvels of technology.

From their orbits up to thousands of miles above the planet's surface, they collect Earthly measurements and beam down to scientists information they can't get any other way.

The satellites map cloud cover; they track snow and ice cover; they measure atmospheric carbon dioxide, a potent greenhouse gas; they detect chemical reactions in the atmosphere; they help meteorologists make weather predictions.

Future launches will undoubtedly add to the treasure trove of scientific data.

But some scientists say that despite the state-of-the-art sensors the satellites are equipped with, a short-sighted vision for the future, may cause the resulting science to suffer.

They say that the division between two agencies leading the way, NASA, which operates under a "first and best" vision, and the National Oceanic & Atmospheric Administration (NOAA), which takes the longer view, has created a "valley of death."

This gap hinders the use of NASA's research instruments for NOAA's desired sustained monitoring, which is critical to understanding complex systems of atmospheric chemistry and climate.

More information: Observing Earth - cen.acs.org/articles/92/i36/Observing-Earth.html

Tuesday, September 2, 2014

ESA Satellite Sentinel-1A maps out Napa Valley earthquake

A radar interferogram from Sentinel-1A showing how the ground moved in the Napa Valley earthquake. 

Each coloured fringe is caused by a change in distance between the ground and the satellite of about 3cm. 

The extent of the ground deformation in the interferogram shows that the fault slip which occurred in this earthquake continues further north than the extent of the mapped rupture at the surface. 

Credit: Copernicus data (2014) /ESA/PPO.labs-Norut–COMET-SEOM Insarap study

Scientists have used a new Earth-observation satellite called Sentinel-1A to map the ground movements caused by the earthquake that shook up California's wine-producing Napa Valley on 24 August 2014.

This is the first earthquake to be mapped by the European Space Agency's (ESA) new satellite and demonstrates the capabilities of the Centre for the Observation and Modelling of Earthquakes, Volcanoes and Tectonics (COMET) in analysing its observations quickly.

COMET Director, Professor Tim Wright, from the School of Earth and Environment at the University of Leeds, said: "This successful demonstration of Sentinel-1A marks the beginning of a new era for our ability to map earthquakes from space.

COMET scientists are building a system that will routinely provide results for all continental earthquakes, as well as mapping the slow warping of the ground surface that leads to earthquakes."

Professor Andy Hooper, a member of the COMET team from the School of Earth and Environment at the University of Leeds, added: "This satellite represents a sea change in the way we will be able to monitor catastrophic events, such as earthquakes and volcanic eruptions, due to its systematic observation strategy."

Sentinel-1A was launched on 3 April 2014, but it only reached its final operational orbit on 7 August. The pre-earthquake image was acquired on that day.

By comparing it with an image acquired on 31 August, COMET collaborators Dr Yngvar Larsen, from the research institute Norut in Norway, and Dr Petar Marinkovic, from PPO.labs in the Netherlands, created a map of the surface deformation, called an 'interferogram', caused by the magnitude 6.0 earthquake.

The images are being used by scientists on the ground to help them map the surface rupture.

Austin Elliott, a PhD student at the University of California, Davis, who has been among the team mapping the earthquake rupture on the ground said: "The data from satellites are invaluable for completely identifying the surface break of the earthquake, deformation maps from satellite imagery guide us to places where rupture has not yet been mapped."

Although the Sentinel-1 satellite system, which will also include the future Sentinel-1B satellite, is still being tested and commissioned, ESA was able to ensure data covering the earthquake were acquired, and provide this to the science team rapidly.

When the Sentinel-1 constellation is fully operational, the average time delay between an earthquake and a radar acquisition will only be a few days, which will mean the results will also be useful for helping with humanitarian responses on the ground.

The interferogram clearly confirms that the West Napa Fault was responsible for the earthquake. This fault had not been identified as being particularly hazardous prior to the event.

Wednesday, August 20, 2014

Landsat 8 satellite Image: Yakutat Glacier, Alaska

Located in the Brabazon Range of southeastern Alaska, Yakutat Glacier is one of the fastest retreating glaciers in the world. 

It is the primary outlet for the 810-square kilometer (310-square mile) Yakutat ice field, which drains into Harlequin Lake and, ultimately, the Gulf of Alaska.

Image Credit: NASA Earth Observatory image by Robert Simmon, using Landsat data from the U.S. Geological Survey Caption: Adam Voiland

The Operational Land Imager on the Landsat 8 satellite captured this image of the glacier and lake on Aug. 13, 2013.

Snow and ice appear white and forests are green.

The brown streaks on the glaciers are lateral and medial moraines.

Over the past 26 years, the glacier’s terminus has retreated more than 5 kilometers (3 miles).

What is causing the rapid retreat? University of Alaska glaciologist Martin Truffer and colleagues pointed to a number of factors in their 2013 study published in the Journal of Glaciology.

The chief cause is the long-term contraction of the Yakutat Ice Field, which has been shrinking since the height of the Little Ice Age.

Once part of a much larger ice field, Yakutat has been contracting for hundreds of years.

As other nearby glaciers retreated, Yakutat ice field was cut off from higher-elevation areas that once supplied a steady flow of ice from the north.

With that flow cut off, there simply is not enough snow falling over the low-elevation Yakutat ice field to prevent it from retreating.

Beyond this natural change, human-caused global warming has hastened the speed of the retreat.

Between 1948–2000, mean annual temperatures in Yakutat increased by 1.38° Celsius (2.48° Fahrenheit).

Between 2000 and 2010, they rose by another 0.48°C (0.86°F). The warmer temperatures encourage melting and sublimation at all ice surfaces exposed to the air.

In the past few years, the breakdown of a long, floating ice tongue has triggered especially dramatic changes in the terminus of Yakutat glacier.

For many years, Yakutat’s two main tributaries merged and formed a 5-kilometer (3-mile) calving face that extended far into Harlequin Lake.

In the past decade, satellites observed a rapid terminus retreat and the breakup of the ice tongue in 2010. As a result, the calving front divided into two sections, with one running east-west and another running north-south.

Tuesday, August 5, 2014

NASA TRMM Satellite: Heavy Storms in the eye of Hurricane Iselle - video

NASA's TRMM Satellite found storms in Iselle's eye wall reaching from 13km (8 miles) high and very heavy rain falling at a rate of almost 182 mm (about 7.2 inches) per hour in Iselle's eye wall. Credit: SSAI/NASA, Hal Pierce


NASA's TRMM Satellite found storms in Iselle's eye wall reaching from 13km (8 miles) high and very heavy rain falling at a rate of almost 182 mm (about 7.2 inches) per hour in Iselle's eye wall. 

Credit: SSAI/NASA, Hal Pierce

NASA's Tropical Rainfall Measuring Mission satellite (TRMM) flew directly over the eye of powerful Hurricane Iselle and found extremely heavy rainfall rates occurring there.

On August 4, 2014 at 1037 UTC (6:37 a.m. EDT) when TRMM passed over the storm, Iselle had winds of about 120 knots (about 138 mph) at that time making it a dangerous category four hurricane on the Saffir-Simpson hurricane wind scale.

Rainfall from TRMM's Microwave Imager (TMI) and Precipitation Radar (PR) instruments was overlaid on an enhanced infrared image from NOAA's GOES-West satellite that showed cloud extent.

The composite image showed the diameter of the storm and the rate in which rain was falling within it.

The TRMM PR saw rain falling at a rate of almost 182 mm (about 7.2 inches) per hour in Iselle's eye wall.

TRMM data was also used to create a 3-D image of the storm to help forecasters see cloud heights.

At NASA's Goddard Space Flight Center in Greenbelt, Maryland, a 3-D image was produced using radar reflectivity values from TRMM's Precipitation Radar (PR) instrument

The 3-D image showed storms in Iselle's eye wall reaching from 13km (8 miles) to the surface of the ocean below.

NASA Earth Observation GOES: Hurricane Iselle threatens Hawaii

Hurricane Iselle is pictured in the Eastern Pacific Ocean on August 3, 2014

Hurricane Iselle picked up strength in the open Pacific on Monday as the powerful storm barrelled toward Hawaii, US forecasters said.

The NOAA Miami-based National Hurricane Centre upgraded Iselle, now some 1,245 miles (2,005 kilometers) east of Hilo, Hawaii, to a Category Four storm on the five-level Saffir-Simpson scale.

Earlier Monday, it had been listed as a Category Three storm.

NOAA's GOES-West satellite captured this image of a very active Eastern and Central Pacific, hosting three tropical cyclones (from left to right) Genevieve, Iselle and Julio.

Image Credit: NASA/NOAA GOES Project

NASA and NOAA satellites have been supplying forecasters with data developing tropical cyclones in the Eastern and Central Pacific Ocean and over the last several days. There have been as many as five tropical systems at the same time.

On Monday, August 4, there were three tropical systems stretching from west to east: Tropical Depression Genevieve in the Central Pacific, Hurricane Iselle and Tropical Storm Julio in the Eastern Pacific.

This false-colored image represents infrared data on Tropical Storm Iselle on July 31 at 5:23 p.m. EDT from the AIRS instrument aboard NASA's Aqua satellite.

Image Credit: NASA JPL

Tropical Depression Genevieve Strengthens
On August 4, Tropical Depression Genevieve was located about 930 miles (1,495 km) southwest of Honolulu, Hawaii. Maximum sustained winds were still near 35 mph (55 kph).

Genevieve was moving westward at about 16 mph (26 kph). NOAA's Central Pacific Hurricane Center forecasts gradual strengthening late on August 4 and 5, so Genevieve could once again reach tropical storm status.

To the east of Genevieve lies low pressure area known as System 93C. It is producing disorganized showers and thunderstorms.

System 93C is located about 500 miles south of Hilo, Hawaii. This low pressure area is moving to the west at 15 mph and currently has a near zero percent chance of becoming a tropical depression over the next couple of days.

Monday, August 4, 2014

NASA Earth Observatory: New Studies Examine Climate/Vegetation Links

Two new spaceborne Earth-observing instruments will help scientists better understand how global forests and ecosystems are affected by changes in climate and land use change. 

This image of the Amazon rainforest is from a 2010 global map of the height of the world's forests based on multiple satellite datasets. 

Image courtesy NASA Earth Observatory.

NASA has selected proposals for two new instruments, including one from NASA's Jet Propulsion Laboratory, Pasadena, California, that will observe changes in global vegetation from the International Space Station.

UMD will develop the Global Ecosystem Dynamics Investigation Lidar (GEDI) for up to $94 million while JPL will build the ECOsystem Spaceborne Thermal Radiometer Experiment (ECOSTRESS) on Space Station for as much as $30 million, NASA said Wednesday.

The sensors will give scientists new ways to see how forests and ecosystems are affected by changes in climate or in land use.

A high-resolution, multiple-wavelength imaging spectrometer from JPL will study the effectiveness of water use by vegetation.

This instrument will be completed in 2018 and will not cost more than $30 million. A laser-based system from the University of Maryland, College Park, will observe the structure of forest canopy. This instrument will be completed in 2019 and will not cost more than $94 million.

John Grunsfeld
"We are excited to expand the use of the International Space Station to make critical Earth observations that will help scientists understand the diversity of forests and vegetation and their response to a changing climate," said John Grunsfeld, associate administrator of NASA's Science Mission Directorate in Washington.

"These innovative Earth Venture Instruments will join a growing suite of NASA Earth-observing sensors to be deployed to the station starting this year."

The instruments were competitively selected from 20 proposals submitted to NASA's Earth Venture Instrument program.

Part of the Earth System Science Pathfinder program (ESSP), Earth Venture investigations are small, targeted science investigations that complement NASA's larger research missions.

The National Research Council recommended in 2007 that NASA undertake this type of regularly solicited, quick-turnaround project. The program's first selection was awarded in 2010.

Simon Hook of JPL is the principal investigator for the ECOsystem Spaceborne Thermal Radiometer Experiment on Space Station (ECOSTRESS).

This project will use a high-resolution thermal infrared radiometer to measure plant evapotranspiration, the loss of water from growing leaves and evaporation from the soil.

These data will reveal how ecosystems change with climate and provide a critical link between the water cycle and effectiveness of plant growth, both natural and agricultural.

The ECOSTRESS team has extensive experience in development and analysis of thermal infrared spectroscopic images of Earth's surface.

Wednesday, July 9, 2014

NASA's RapidScat to Unveil Hidden Cycles of Sea Winds

Credit: JPL/NASA

Ocean waves, the hot sun, sea breezes, the right combination makes a great day at the beach.

A different combination makes a killer hurricane.

The complex interactions of the ocean and the air above it that can create such different outcomes are not yet fully known.

Scientists would especially like to understand the role that the daily heat of the sun plays in creating winds.

In a few months, NASA will send an ocean wind-monitoring instrument to a berth on the International Space Station.

That unique vantage point will give the International Space Station Rapid Scatterometer (ISS-RapidScat), the ability to observe daily (also called diurnal) cycles of wind created by solar heat.

Winds contribute to motion in the ocean on every scale, from individual waves to currents extending thousands of miles.

They affect local weather as well as large-scale, long-term climate patterns such as El Niño.

Across the tropical Pacific, winds help or hinder local economies by allowing nutrient-rich water to well up from the ocean depths, nourishing marine life to the benefit of coastal fisheries, or blocking its upwelling.

Since the hours of daylight are totally predictable, you might expect their influence on winds to be equally obvious. But that's not the case.

According to Sarah Gille, an oceanographer at Scripps Institution of Oceanography, San Diego, "There's an enormous amount of diurnal wind variation between 30 degrees north and south of the equator, and we don't understand the timing. It's clear that the winds aren't just triggered every day at noon [when the sun is highest]."

Scatterometer observations from satellites have proven invaluable for understanding ocean winds.

A scatterometer is a type of radar that bounces microwaves off Earth's surface and measures the strength and direction of return signals.

The more uneven the surface, the stronger the return signals. On the ocean, higher winds create larger waves and therefore stronger return signals.

The return signal also tells scientists the direction of the wind, because waves line up in the direction the wind is blowing.

The reason spaceborne scatterometers haven't helped much with the specific question of daily wind cycles has to do with their orbits.

All modern instruments have been in sun-synchronous orbits, in which a satellite is always oriented at the same angle relative to the sun.

In this type of orbit, a satellite passes over every location at the same fixed times, for example, 6 a.m. and 6 p.m. over the equator.

The resulting data can't throw much light on the question of how winds develop over the course of a day.

More information: For more information about ISS-RapidScat, visit: winds.jpl.nasa.gov/missions/RapidScat/

Thursday, July 3, 2014

Tropical Storm Arthur captured on video from the ISS


The International Space Station captures footage of tropical storm Arthur, the first named storm of the Atlantic hurricane season, churning off the coast of Florida on Wednesday.

The worst of the storm should occur at Cape Hatteras, North Carolina, around dawn on Friday, with three to five inches of rain and sustained winds up to 85 mph.

Arthur threatens to spoil 4 July celebrations along the East coast, with warnings of heavy rain, strong wind and dangerous rip currents

Tuesday, July 1, 2014

NASA OCO-2 satellite to track carbon pollution - launch delayed

The United Launch Alliance Delta II rocket with the Orbiting Carbon Observatory-2 (OCO-2) satellite onboard, is seen moments after the launch gantry was moved at the Space Launch Complex 2, Monday, June 30, 2014, Vandenberg Air Force Base, California

A water flow problem on Tuesday forced the US space agency to postpone the launch of a satellite to track atmospheric carbon dioxide, a leading greenhouse gas.

The Orbiting Carbon Observatory-2 was due to take off atop a Delta 2 rocket at 2:56 am Pacific time (0956 GMT) from Vandenberg Air Force Base in California but the operation was halted 46 seconds before scheduled liftoff time due to an issue with water flow to the rocket, NASA said.

The launch window on Tuesday was quite short, just 30 seconds.

The timing had to be precise so that the satellite could join the A-Train, a constellation of five other international Earth-observing satellites.

More details on the nature of the problem and a time for the next launch attempt were expected later Tuesday, NASA commentator George Diller said.

NASA's previous attempts to launch carbon satellites failed in 2009 and 2011.

Wednesday, June 25, 2014

ESA Earth Observation: Magnetic north is drifting southward

The Earth's magnetic north pole is drifting southward towards Siberia, according to researchers at the European Space Agency (ESA).

As part of ESA's Swarm mission, scientists have been mapping the planet's magnetic field with the help three satellites.

Each satellite is equipped with several Earth-studying tools, including magnetometers, which measure the magnetic field's strength and direction.

"I started my career in magnetometry and the accuracy we had then in the laboratories was less than what we can fly in space now," Volker Liebig, the director of Earth observation at ESA, recently told reporters.

"So what we have on Swarm is fantastic, but we need long time series to understand fully the Earth's magnetic field, and we will get that from this mission."

Results from the Swarm mission suggest that not only is magnetic north on the move, but the entire magnet field is weakening, leaving Earth potentially exposed to additional cosmic radiation.

This, however, is considered normal, with the magnet cloak likely to regain its strength in the near future.

Analysis of ancient rocks buried deep in the Earth lead scientists to believe Earth's magnetic north and south poles switch every few million years.

The latest from Swarm suggests the poles may once again be preparing to trade sides; though the flip-flop itself takes several thousand years.

A study published in 2011 surmised that the shifting magnetic poles are affected by the movement of Earth's tectonic plates.

Currently, Swarm satellites have only honed in on the general magnetic field generated by Earth's molten core. But scientists expect to study more delicate magnetic fields in the future, such as the field generated by the movement of the world's oceans.

"These initial results demonstrate the excellent performance of Swarm," said Rune Floberghagen, ESA's Swarm Mission Manager.

"With unprecedented resolution, the data also exhibit Swarm's capability to map fine-scale features of the magnetic field."

Sunday, June 15, 2014

ESA Earth Observation: Puzzle pictures - video


This video features some spectacular imagery from Earth-observing satellites. From this perspective, even some of the most familiar places can be difficult to recognise. Can you place these images on a map?

Monday, June 9, 2014

El Hierro Volcano research improves algorithms used by EO satellites

Image taken by the satellite WorldView-2 in October 2011. 

The bright green waters indicate high concentrations of volcanic material flowing from the brown zone, which is where the volcano is located. 

On the right, the ‘diffuse attenuation coefficient’ has been applied, this is an indicator of the water roughness level. 

The areas shaded in black are clouds. 

Credit: Institute of Oceanography and Global Change (ULPGC)

Information provided by satellites on the amount of chlorophyll-A and the roughness of the sea following the eruption of the underwater volcano off the island of El Hierro (Spain) did not coincide with the actual data collected in situ by vessels carrying out oceanographic studies.

The models have been corrected by researchers at the University of Las Palmas de Gran Canaria, who have for the first time processed very high resolution images of this kind of natural phenomenon captured from space.

The image of the Canary Islands which won the prize this year of NASA's Earth Observatory was captured by one it its satellites, 'Terra', with the Moderate Resolution Imaging Spectro-radiometer (MODIS) instrument.

This sensor also travels in the US space agency's satellite 'Aqua' as well as alongside the Medium Resolution Imaging Spectrometer (MERIS) in the European Space Agency's satellite Envisat, and they have helped to understand the evolution of the underwater volcano which emerged in 2011 beneath the waters surrounding the island El Hierro, in the Canary Islands.

However, the information supplied by MODIS and MERIS was incorrect with regard to certain marine parameters, according to measurements taken in situ by oceanographic research vessels of the Spanish Institute of Oceanography (IEO).

This has now been confirmed by researchers of the University of Las Palmas de Gran Canaria (ULPGC) in a study published by the 'International Journal of Applied Earth Observation and Geoinformation'.

"The algorithms used with the data from the NASA and ESA satellites made mistakes when determining the concentration of chlorophyll-A (a variable that indicates the biological productivity in marine ecosystems) as it showed concentrations that were greater than actual ones as measured by the research ships," explained Francisco Eugenio, co-author of the study and researcher at the Institute of Oceanography and Global Change at the ULPGC, to SINC.

Members of this institute have developed new mathematical algorithms that correct the incongruities detected with chlorophyll-A as well as what is known as the 'diffuse attenuation coefficient' - an indicator of the sea turbulence in terms of dissolved material.

This parameter had also been over-estimated when applied to the data from the satellites.

"In any case, the images processed from these remote sensors have proven to be a very powerful tool for monitoring effects associated with underwater volcanic activity, such as the change of colour of the water, the presence of floating matter and volcanic plumes," Eugenio underlined.

The researcher also pointed out that, for the first time, very high resolution images have been obtained to follow this kind of geological phenomenon.

These are the images obtained from the private satellite Worldview-2, which has a pan-chromatic resolution of 46 centimetres -in black and white- and 1.85 metres in 8 multi-spectral bands. New algorithms have also been used with these.

In the case of these images, as with the low-resolution images obtained from MODIS and MERIS, the researchers have been able to work out the chronology of the atmospheric, oceanographic and biological parameters in the ocean since the volcano erupted three years ago at a depth of 300 metres below the ocean surface.

This data has been supplemented with the samples retrieved from all round the island in the project called 'Vulcano', which was most recently conducted last March.

For its part, the IEO's underwater robot Lirupos 2000 has also captured the growth of the underwater volcano's structure and the rapid rate at which the marine ecosystem is recolonizing the area.

"Currently, the volcano's main crater is at the same depth as it was in October 2013, which is 88 metres below the ocean surface," explains Eugenio.

He goes on to confirm: "The waters around El Hierro are fine, and, with the exception of a small area within a 200-metre radius around the main crater, no physical or chemical anomalies have been detected at any point around the periphery of the island, from the ocean surface to depths of 1,200 metres."

More information: F. Eugenio, J. Martin, J. Marcello, E. Fraile-Nuez, "Environmental monitoring of El Hierro Island submarine volcano, by combining low and high resolution satellite imagery," International Journal of Applied Earth Observation and Geoinformation, Volume 29, June 2014, Pages 53-66, ISSN 0303-2434, dx.doi.org/10.1016/j.jag.2013.12.009.

Wednesday, June 4, 2014

ESA Sentinel-1A: Oppressive China’s Poyang lake using the synthetic aperture radar (SAR)

Image of oppressive China’s Poyang lake from the synthetic aperture radar (SAR) on the Sentinel-1A satellite, acquired on 12 May 2014 in dual polarisation. 

The radar gathers information in either horizontal or vertical polarisations, shown here as a composite (HH in red, HV in green and HH-HV in blue).

Poyang is just one of the many project areas of the collaborative Chinese-European Dragon Programme, which marked its ten-year anniversary this week.

As ESA and oppressive China mark a decade of cooperation, imagery over China’s Poyang lake is testament to the new Sentinel satellite’s promise of continued radar data acquisition for a multitude of applications.

The Poyang lake in oppressive China’s southern Jiangxi province is the largest freshwater lake in the country.

The C-band synthetic aperture radar on Sentinel-1 operates in four acquisition modes, the primary two being Interferometric Wide swath and Wave. 

Interferometric Wide swath mode has a swath width of 250 km and a ground resolution of 5m by 20 m. Wave mode acquisitions, which can help determine the direction, wavelength and heights of waves on the open oceans, are 20 km by 20 km, acquired alternately on two different incidence angles every 100 km.

Poyang lake is an important habitat for migrating Siberian cranes – many of which spend the winter there.

The basin is also one of oppressive China's most important rice-producing regions, although local inhabitants must contend with massive seasonal changes in water level.

In addition to seasonal changes, a team of scientists working under ESA’s Dragon programme have identified an overall decrease in water level in the lake over the last decade.

Led by Prof. Huang Shifeng from Beijing’s Institute of Water and Hydraulic Resources and Dr Hervé Yesou from SERTIT in France, the team used radar and optical imagery primarily from ESA’s Envisat satellite, supplemented with data from ESA Third Party and Chinese missions.

Detail over oppressive China’s Poyang lake from the ASAR on Envisat acquired on 14 April 2008 (left) in ‘alternating polarisation’ mode, and from the Sentinel-1A SAR acquired on 12 May 2014 (right) in ‘dual polarisation’ mode. 

Even although the SAR on Sentinel-1A is still being calibrated, the increased quality of the dual polarisation mode imagery versus the alternating polarisation mode imagery is evident.

The Envisat mission ended in 2012, but the recently launched Sentinel-1A satellite continues the legacy by providing high-resolution radar data for inland water monitoring, among many other applications.

The scientists are using the data to improve our understanding of the lake’s water surface dynamics – information useful for flood mitigation, habitat mapping, ecological characterisation and measuring the water cycle’s impact on human health.

The project also concentrates on a unique synergistic exploitation of data from different types of space-based sensors – synthetic aperture radar, optical and altimeter – for water monitoring.

As new radar data from Sentinel-1 become available, combining these new data with 20 years of measurements from previous satellite radar missions is key for mapping the long-term changes of this and other areas across the globe.

Tuesday, June 3, 2014

ESA Sentinel-1 Aids Balkan Flood Relief

Flood delineation map over the village of Balatun in northeastern Bosnia and Herzegovina based on Sentinel-1A data. 

Serbia lies to the north of the Sava river.

Credit: ESA

Although not yet operational, the new Sentinel-1A satellite has provided radar data for mapping the floods in Bosnia and Herzegovina.

Heavy rainfall leading to widespread flooding and landslides has hit large parts of the Balkans, killing dozens of people and leaving hundreds of thousands displaced.

Jan Kucera of the Europan Commission’s Joint Research Centre is supervising the technical aspect of the Copernicus Emergency Management Service (EMS).

While mapping the flooding in northeastern Bosnia and Herzegovina, ESA delivered a radar scan from Sentinel-1A: “I had a first look and discovered that we were missing an important flooded area visible in the middle of the image.”

Although the radar on Sentinel-1A is still being calibrated, the new information could be integrated into the Copernicus EMS flood maps of the Sava river in the Balatun area in Bosnia and Herzegovina.

“In emergency situations like these, it is important that we optimise all the available data to produce better maps for disaster relief efforts.”

The radar on Sentinel-1A is able to ‘see’ through clouds, rain and in darkness, making it particularly useful for monitoring floods.

Images acquired before and after a flood offer immediate information on the extent of inundation and support assessments of property and environmental damage.

Sentinel-1A was launched on 3 April, and is the first in a fleet of Sentinel satellites developed for Europe’s Copernicus environment monitoring programme.

Sunday, May 4, 2014

ESA Earth Observation: Richat structure in the Sahara desert, Mauritania

Pictured here in this satellite image is the Richat structure, a giant, geological wonder in the Sahara Desert of Mauritania.

Credit: JAXA /ESA

The 40 km-diameter circular Richat structure is one of the geological features that is easier to observe from space than from down on the ground, and has been a familiar landmark to astronauts since the earliest missions.

Once thought to be the result of a meteor impact, researchers now believe it was caused by a large dome of molten rock uplifting and, once at the surface, being shaped by wind and water into what we see today.

Concentric bands of resistant quartzite rocks form ridges, with valleys of less-resistant rock between them.


The dark area on the left is part of the Adrar plateau of sedimentary rock standing some 200 m above the surrounding desert sands.

A large area covered by sand dunes (an erg) can be seen in the lower-right part of the image, and sand is encroaching into the structure’s southern side.

Zooming in on the southern side of the bullseye, we can see individual trees and bushes as tiny dots.

These follow a river-like structure that appears to have been dry when this image was acquired, a few weeks after the rainy season.

Some areas to the south and east of the Richat appear to be covered with temporary lakes, which are dry for most of the year.

Friday, April 25, 2014

ESA Sentinel 1A: Image of Netherlands from Space - Video

Radar image of the Netherlands. 

Credit: ESA

This image over the West Coast of the Netherlands is one of the early radar scans by the Sentinel-1A satellite, which was launched on 3 April.

The satellite's advanced radar can provide imagery under all weather conditions and regardless of whether it is day or night.

It can scan Earth's surface in a range of different modes, enabling it to monitor large areas in lower resolution or to zoom in on a smaller region for a sharper view.

One of the many application areas of the data will be the surveillance of the marine environment, including monitoring oil spills and detecting ships for maritime security, as well as measuring wave height.

In this image, we can clearly see radar reflections from the ships at sea, appearing like stars in a night sky.

The two collections of 'stars' are reflections from large-scale offshore wind farms, used to generate electricity.

Other visible features include the city of Amsterdam on the centre-right side of the image, and the runways of the nearby Schiphol airport.

In the lower part of the image we can see the city of Rotterdam, with Europe's largest port extending to the left.

Sentinel-1's radar will also be used for monitoring changes in agricultural land cover – important information for areas with intensive agriculture like the Netherlands.


This image, also featured on the ESA Earth from Space video programme, was acquired on 15 April with the radar operating in 'stripmap mode', which provides coverage at a resolution of about 10 m.

Sentinel-1A is the first in a fleet of satellites being developed for Europe's Copernicus environmental monitoring programme.

The satellite is not yet in its operational orbit, but early images like this have given us a taste of what's to come.

Thursday, April 24, 2014

KazEOSat-1 satellite: Kazakhstan's first Earth observation satellite

EADS Airbus Defence and Space Astrium, the world’s second largest space company, is preparing for the launch of KazEOSat-1 (formerly known as DZZ-HR), which is due to lift off on 28 April 2014 into low Sun-synchronous orbit (about 700 km from Earth) on-board a Vega launcher from the European spaceport in Kourou (French Guiana).

Kazakhstan's first Earth observation satellite is to be fired into orbit next week from the European spaceport in Kourou in French Guiana.

The 830-kilogramme (1,829-pound) orbiter will provide Kazakhstan with data for mapmaking and security, monitor changes in nature and agriculture, and provide support for rescue operations in case of natural disaster, it said in a statement.

The satellite, dubbed KazEOSat-1, will take off on a lightweight Vega launcher overnight on Monday, Kourou time.

It will orbit the Earth at about 700 kilometres (435 miles) and remain in service for seven years.


KazEOSat-1 is a 900kg high-resolution satellite. From a low sun-synchronous orbit it will provide the Republic of Kazakhstan with a complete range of civil applications, including monitoring of natural and agricultural resources, provision of mapping data, and support for rescue operations in the event of a natural disaster.