Showing posts with label Solar Activity. Show all posts

Wednesday, November 26, 2014

Supercomputer Simulation of Magnetic Field Loops on the Sun

Magnetic fields emerging from below the surface of the sun influence the solar wind, a stream of particles that blows continuously from the sun’s atmosphere through the solar system. 

Researchers at NASA and its university partners are using high-fidelity computer simulations to learn how these magnetic fields emerge, heat the sun’s outer atmosphere and produce sunspots and flares.

This visualization shows magnetic field loops in a portion of the sun, with colors representing magnetic field strength from weak (blue) to strong (red). 

The simulation was run on the Pleiades supercomputer at the NASA Advanced Supercomputing facility at NASA's Ames Research Center in Moffett Field, California. 

The knowledge gained through simulation results like this one help researchers better understand the sun, its variations, and its interactions with Earth and the solar system.

Image Credit: Robert Stein, Michigan State University; Timothy Sandstrom, NASA/Ames

Tuesday, October 28, 2014

Giant Sunspot Keeps Firing Off Huge Solar Flares


The largest sunspot observed on the sun in more than 20 years has been firing off powerful solar flares for the past week, and it's still producing strong solar storms.

Today, the huge sunspot erupted with a large solar flare, peaking at around 10:47 a.m. EDT (1447 GMT).

The flare caused a strong radio blackout on Earth, according to the National Weather Service's Space Weather Prediction Center. This solar flare is the fourth X-flare (the most powerful kind of solar storms) in as many days.

On Sunday (Oct. 26), the giant sunspot unleashed a solar flare, which peaked at about 6:56 a.m. EDT (1056 GMT). The sunspot, called Active Region 12192 (also known as AR 2192), also shot out another powerful flare on Saturday. Today and Sunday's flares measured in at X2, while Saturday's is classified as an X1 flare.

Sunday's X2-class flare was "the third X-class flare in 48 hours, erupting from the largest active region seen on the sun in 24 years," NASA spokesperson Karen Fox wrote in an update yesterday (Oct. 26). AR 2129 also shot out an X3.1-class flare on Friday (Oct. 24).

The sun unleashed an X2-class solar flare on Oct. 26, 2014. NASA's Solar Dynamics Observatory captured this photo of the flare (lower right).

Credit: NASA/SDO

Wednesday, October 22, 2014

NASA SDO: Electromagnetic 'Twisted rope' clue to dangerous solar storms

Model of the magnetic field in the region where occurred a major flare on December 13th 2006. 

This model has been obtained using magnetic field data obtained at the surface of the Sun by the satellite HINODE and the high resolution model MESHMHD few hours before the eruption. 

It shows that a magnetic rope (grey) is maintained in equilibrium by overlaying arcades (orange). 

Credit: Tahar Amari /Centre de physique théorique.CNRS-Ecole Polytechnique.FRANCE.

A "twisted rope" of magnetically-charged energy precedes solar storms that have the potential to damage satellites and electricity grids, French scientists said on Wednesday.

A cord of magnetic flux emerges on the Sun's surface, grows and is squeezed upwards, and the following day, the star unleashes a blast of radiation, high-energy particles and magnetised plasma.

Solar outbursts are considered a rare but increasingly worrisome risk for satellites, global positioning systems (GPS) and power grids on which modern life depends.

Reporting in the journal Nature, a team led by Tahar Amari of France's National Centre for Scientific Research (CNRS) looked at a solar storm that brewed in December 2006 and happened to be observed by a Japanese scientific satellite.

"We were able to identify the source of the eruption four days before it developed," Amari said to reporters.

"The magnetic field builds up in the shape of a twisted rope. The ends of the rope are anchored in sunspots," he said, referring to notoriously magnetised features on the solar surface.

Experts say solar storms can cause widespread breakdowns, disabling everything from power and radio to GPS geo-location and water supplies which rely on electrical pumps.

View of typical solar eruption using data from the NASA Solar Dynamic Observatory space mission. 

The Earth has been shown to show the gigantic size of the phenomena 

Credit: Tahar Amari /Centre de physique théorique.CNRS-Ecole Polytechnique.FRANCE

They begin with an explosion on the Sun's surface, known as a solar flare, sending X-rays and extreme ultra-violet radiation towards Earth at light speed.

Hours later, energetic particles follow and these electrons and protons can electrify satellites and damage their electronics.

Next are coronal mass ejections (CME), billion-tonne clouds of magnetised plasma that take a day or more to cross the Sun-Earth gap.

A solar storm in 1859 caused an electrical surge on telegraph lines that prompted some offices to catch fire and operators to receive shocks. A 1989 event caused power outages for five million people in the Canadian province of Quebec.

A 2009 report by a panel of scientists assembled by NASA warned that a catastrophic solar storm could cost the United States alone up to two trillion dollars (1.6 trillion euros) in repairs in the first year, and it could take up to 10 years to fully recover.

Predicting when these events will take place, and if Earth lies in their path, has been thwart with problems.

Eruption of the magnetic rope in the dynamic model METEOSOL after its departure from equilibrium 

Credit: Tahar Amari /Centre de physique théorique.CNRS-Ecole Polytechnique.FRANCE

On July 23, 2012, Earth narrowly missed the biggest storm in 150 years, an event big enough to "knock modern civilisation back to the 18th century," yet few humans were even aware of the peril, NASA said last July.

At present, Earth gets a few hours' warning of a solar eruption thanks to the eyes of orbiting US satellites.

But, said Amari, warning time should eventually improve.

"The work will help us fine tune knowledge about impending solar eruptions," he said.

"Using real-time magnetic data and mathematical models, it will eventually be possible to predict space weather."

More information: Characterizing and predicting the magnetic environment leading to solar eruptions, Nature, dx.doi.org/10.1038/nature13815

Monday, October 20, 2014

Solar Photosphere: Hot explosions on the cool sun

Sizzling star: Hot explosions in an active region of the Sun. 

In this image of the photosphere that was obtained at the end of September 2013 with the help of IRIS, the explosions are the bright spots. 

The image shows a sector with a size of 50,000 kilometers by 25 000 kilometers. 

Credit: NASA

The Sun is more spirited than previously thought. Apart from the solar eruptions, huge bursts of particles and radiation from the outer atmosphere of our star, also the cooler layer right below can be the site of explosions: in some areas magnetic energy builds up and discharges within only a few minutes in temperature eruptions of up to 100000 degrees.

Researchers under the lead of the Max Planck Institute for Solar System Research have now for the first time found evidence of such short-lived heat pockets in data from NASA's space telescope IRIS (Interface Region Imaging Spectrograph).

The Sun is an incredibly hot place, but even though in all its layers the temperatures are daunting, some are hotter than others.

With a temperature of approximately 5000 degrees, the Sun's visible surface, the photosphere, for example, is comparatively cool.

Going outward from there, the temperatures within the Sun's atmosphere rise, first moderately and then sharply, until they reach one million degrees.

"Our analysis shows, that this temperature distribution is not the same everywhere, and is constantly in motion", says Prof. Dr. Hardi Peter from the MPS, the paper's first author.

Together with an international team of scientists, Peter analyzed data from the space telescope IRIS taken from active regions on the Sun.

These regions within the photosphere are characterized by high magnetic field strengths and are the "birth places" of the dark sunspots, which cover the Sun's surface, at some times more, at others less abundantly.

"In these regions we found heat pockets as big as half of Germany. They are up to 20 times as hot as their surroundings", the astrophysicist describes. The heat pockets flash up for only minutes and then return to their normal state.

The amount of energy released during these explosions would be sufficient to provide all of Germany with electrical power for 8000 years.

The massive photospheric explosions cannot be spotted in visible light, but leave traces in the ultraviolet radiation the Sun emits into space.

IRIS can split this ultraviolet radiation into its constituting wavelengths more precisely than any other solar observatory before. In addition, it offers an unprecedented spatial resolution.

When IRIS opened its eyes to the Sun for the first time in July of last year, it could discern structures with a size of only 250 kilometers and examine radiation from such small regions separately.

"To our great surprise, we found well-defined areas within the active regions emitting radiation quite unlike the radiation from their vicinity", says Peter.

The researchers discovered characteristic wavelengths that special highly ionized atoms within the solar plasma such as triply ionized silicon ions emit into space.

"The presence of these wavelengths within the spectra points to very high temperatures", says Peter.

Only under such conditions can silicon loose three of its electrons, but in which of the Sun's layers did this temperature arise? Truly within the cool photosphere? Or maybe, and this would be much less spectacular, farther outside in the much hotter atmosphere?

The spectral data from IRIS proved to be so detailed that the researchers could extract further decisive clues.

For example, they were able to infer the density of the solar plasma where the radiation originated. In addition, they showed that the radiation had encountered singly-ionized iron ions on its way outward. These ions occur only in cooler regions.

"All in all, we found a coherent picture: the unusual radiation must originate in the cool outer photosphere" says Peter.

The researchers believe that the strong magnetic fields in the photosphere provide the necessary energy for the explosions.

In the area of the sun spots, the magnetic field lines protrude in a loop-like fashion from the Sun's surface; hot plasma flows there. When these flows are short-circuited, the explosions occur.

"The new results have fundamentally changed our understanding of the Sun's outer buildup", says Peter. "Instead of a stable temperature distribution, there are apparently dynamical processes within the cool photosphere that can turn everything topsy turvy."

Already in 1917, the American physicist Ferdinand Ellermann discovered areas with higher temperatures within the photosphere.

However, they differed from their surroundings only by a few thousand degrees and can therefore be considered rather minor temperature deviations. Whether the newly discovered explosions are linked to this phenomenon, is still unclear.

One of the other publications in Science magazine, to which scientists from the MPS have contributed, also paints a new picture of the processes on the Sun.

Researchers under the lead of the Harvard-Smithsonian Center for Astrophysics found that the solar wind, the continuous stream of particles from the Sun, does not leave the Sun's surface uniformly, but locally in highly energetic jets. These observations, too, are based on data from IRIS.

More information: 
H. Peter et al. "Hot Explosions in the Cool Atmosphere of the Sun." Science, 17 October 2014 - DOI: 10.1126/science.1255726

H. Tian et al. "Prevalence of Small-scale Jets from the Networks of the Solar Transition Region and Chromosphere." Science, 17 October 2014 - DOI: 10.1126/science.1255732

Saturday, October 18, 2014

NASA SDO: IRIS captures New information about sun's atmosphere

NASA’s Solar Dynamics Observatory provided the outer image of a coronal mass ejection on May 9, 2014. 

The IRIS mission views the interface region that lies between the sun’s photosphere and corona in unprecedented detail for researchers to study.

Credit: NASA, Lockheed Martin Solar & Astrophysics Laboratory

NASA's Interface Region Imaging Spectrograph (IRIS) has provided scientists with five new findings into how the sun's atmosphere, or corona, is heated far hotter than its surface, what causes the sun's constant outflow of particles called the solar wind, and what mechanisms accelerate particles that power solar flares.

The new information will help researchers better understand how our nearest star transfers energy through its atmosphere and track the dynamic solar activity that can impact technological infrastructure in space and on Earth.

Details of the findings appear in the current edition of Science "On the prevalence of small-scale twist in the solar chromosphere and transition region"DOI: 10.1126/science.1255732

"These findings reveal a region of the sun more complicated than previously thought," said Jeff Newmark, interim director for the Heliophysics Division at NASA Headquarters in Washington.

"Combining IRIS data with observations from other Heliophysics missions is enabling breakthroughs in our understanding of the sun and its interactions with the solar system."

The first result identified heat pockets of 200,000 degrees Fahrenheit, lower in the solar atmosphere than ever observed by previous spacecraft.

Scientists refer to the pockets as solar heat bombs because of the amount of energy they release in such a short time.

Identifying such sources of unexpected heat can offer deeper understanding of the heating mechanisms throughout the solar atmosphere.

For its second finding, IRIS observed numerous, small, low lying loops of solar material in the interface region for the first time.

The unprecedented resolution provided by IRIS will enable scientists to better understand how the solar atmosphere is energized.

A surprise to researchers was the third finding of IRIS observations showing structures resembling mini-tornadoes occurring in solar active regions for the first time.

These tornadoes move at speeds as fast as 12 miles per second and are scattered throughout the chromosphere, or the layer of the sun in the interface region just above the surface.

These tornados provide a mechanism for transferring energy to power the million-degree temperatures in the corona.

Another finding uncovers evidence of high-speed jets at the root of the solar wind. The jets are fountains of plasma that shoot out of coronal holes, areas of less dense material in the solar atmosphere and are typically thought to be a source of the solar wind.

The final result highlights the effects of nanoflares throughout the corona. Large solar flares are initiated by a mechanism called magnetic reconnection, whereby magnetic field lines cross and explosively realign.

These often send particles out into space at nearly the speed of light. Nanoflares are smaller versions that have long been thought to drive coronal heating.

IRIS observations show high energy particles generated by individual nanoflare events impacting the chromosphere for the first time.

"This research really delivers on the promise of IRIS, which has been looking at a region of the sun with a level of detail that has never been done before," said De Pontieu, IRIS science lead at Lockheed Martin in Palo Alto, California.

"The results focus on a lot of things that have been puzzling for a long time and they also offer some complete surprises."

More Information
Science "On the prevalence of small-scale twist in the solar chromosphere and transition region"DOI: 10.1126/science.1255732

Tuesday, August 19, 2014

Global Warming, Climate Change and solar activity

The number of sunspots (white area here) varies in multi-year cycles. 

As a result, solar irradiance, which influences the Earth's climate, also fluctuates. 

The photo shows a UV image of the sun. 

Credit Image: Trace Project / NASA

The number of sunspots (white area here) varies in multi-year cycles. 

As a result, solar irradiance, which influences the Earth's climate, also fluctuates. The photo shows a UV image of the sun. 

Credit: Trace Project / NASA

The average temperature on Earth has barely risen over the past 16 years. ETH researchers have now found out why, and they believe that global warming is likely to continue again soon.

Global warming is currently taking a break: whereas global temperatures rose drastically into the late 1990s, the global average temperature has risen only slightly since 1998, surprising, considering scientific climate models predicted considerable warming due to rising greenhouse gas emissions.

Climate sceptics used this apparent contradiction to question climate change per se, or at least the harm potential caused by greenhouse gases, as well as the validity of the climate models.

Meanwhile, the majority of climate researchers continued to emphasise that the short-term 'warming hiatus' could largely be explained on the basis of current scientific understanding and did not contradict longer term warming.

Researchers have been looking into the possible causes of the warming hiatus over the past few years. For the first time, Reto Knutti, Professor of Climate Physics at ETH Zurich, has systematically examined all current hypotheses together with a colleague.

In a study published in the latest issue of the journal Nature Geoscience, the researchers conclude that two important factors are equally responsible for the hiatus.

El Niño warmed the Earth
One of the important reasons is natural climate fluctuations, of which the weather phenomena El Niño and La Niña in the Pacific are the most important and well known.

"1998 was a strong El Niño year, which is why it was so warm that year," says Knutti. In contrast, the counter-phenomenon La Niña has made the past few years cooler than they would otherwise have been.

Although climate models generally take such fluctuations into account, it is impossible to predict the year in which these phenomena will emerge, says the climate physicist.

To clarify, he uses the stock market as an analogy: "When pension funds invest the pension capital in shares, they expect to generate a profit in the long term."

At the same time, they are aware that their investments are exposed to price fluctuations and that performance can also be negative in the short term.

However, what finance specialists and climate scientists and their models are not able to predict is when exactly a short-term economic downturn or a La Niña year will occur.

Longer solar cycles
According to the study, the second important reason for the warming hiatus is that solar irradiance has been weaker than predicted in the past few years.

This is because the identified fluctuations in the intensity of solar irradiance are unusual at present: whereas the so-called sunspot cycles each lasted eleven years in the past, for unknown reasons the last period of weak solar irradiance lasted 13 years.

Furthermore, several volcanic eruptions, such as Eyjafjallajökull in Iceland in 2010, have increased the concentration of floating particles (aerosol) in the atmosphere, which has further weakened the solar irradiance arriving at the Earth's surface.

The scientists drew their conclusions from corrective calculations of climate models. In all climate simulations, they looked for periods in which the El Niño/La Niña patterns corresponded to the measured data from the years 1997 to 2012.

With a combination of over 20 periods found, they were able to arrive at a realistic estimate of the influence of El Niño and La Niña.

They also retroactively applied in the model calculations the actual measured values for solar activity and aerosol concentration in the Earth's atmosphere.

Model calculations corrected in this way match the measured temperature data much more closely.

Incomplete measured data
The discrepancy between the climate models and measured data over the past 16 years cannot solely be attributed to the fact that these models predict too much warming, says Knutti.

The interpretation of the official measured data should also be critically scrutinised. According to Knutti, measured data is likely to be too low, since the global average temperature is only estimated using values obtained from weather stations on the ground, and these do not exist everywhere on Earth.

From satellite data, for example, scientists know that the Arctic region in particular has become warmer over the past years, but because there are no weather stations in that area, there are measurements that show strong upward fluctuations. As a result, the specified average temperature is too low.

Last year, British and Canadian researchers proposed an alternative temperature curve with higher values, in which they incorporated estimated temperatures from satellite data for regions with no weather stations.

If the model data is corrected downwards, as suggested by the ETH researchers, and the measurement data is corrected upwards, as suggested by the British and Canadian researchers, then the model and actual observations are very similar.

Warming to recommence
Despite the warming hiatus, Knutti is convinced there is no reason to doubt either the existing calculations for the climate activity of greenhouse gases or the latest climate models.

"Short-term climate fluctuations can easily be explained. They do not alter the fact that the climate will become considerably warmer in the long term as a result of greenhouse gas emissions," says Knutti.

He believes that global warming will recommence as soon as solar activity, aerosol concentrations in the atmosphere and weather phenomena such as El Niño naturally start returning to the values of previous decades.

More information: Huber M, Knutti R: Natural variability, radiative forcing and climate response in the recent hiatus reconciled. Nature Geoscience, online publication 17 August 2014, DOI: 10.1038/ngeo2228

Monday, August 11, 2014

NASA SDO captures long solar filament

Credit: SDO

A very long filament hung across the sun’s surface for over a week from July 31 to Aug. 6, 2014.

The filament appears as the dark line going diagonally across the center of the sun in this image.

Filaments consist of clouds of cooler gas raised above the sun’s surface by magnetic forces.

Normally they exhibit a great deal of instability and break apart in days or even hours.

This image was obtained in the 191 Angstrom wavelength of extreme ultraviolet light, and has been tinted red instead of the usual brown colour.

Saturday, August 2, 2014

NASA SDO: EUNIS mission - Coronal Heating theory detected

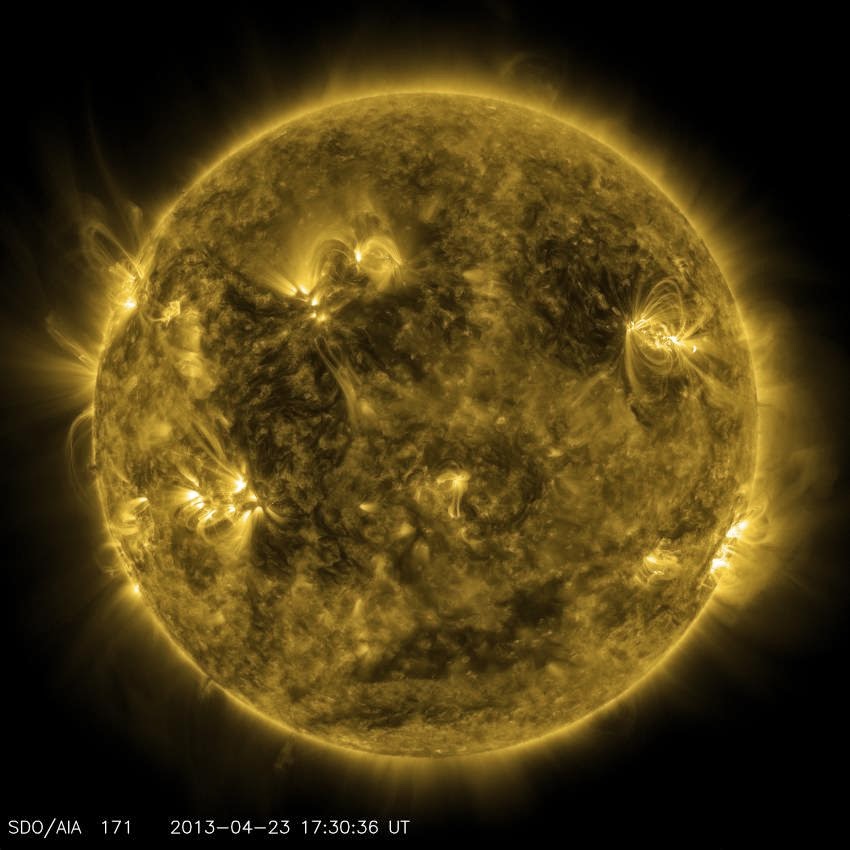
NASA's Solar Dynamics Observatory captured this image of what the sun looked like on April 23, 2013, at 1:30 p.m. EDT when the EUNIS mission launched. 

EUNIS focused on an active region of the sun, seen as bright loops in the upper right in this picture. 

Credit: NASA/SDO

Scientists have recently gathered some of the strongest evidence to date to explain what makes the sun's outer atmosphere so much hotter than its surface.

The new observations of the small-scale extremely hot temperatures are consistent with only one current theory: something called nanoflares; a constant peppering of impulsive bursts of heating, none of which can be individually detected, provide the mysterious extra heat

What's even more surprising is these new observations come from just six minutes worth of data from one of NASA's least expensive type of missions, a sounding rocket.

The Extreme Ultraviolet Normal Incidence Spectrograph (EUNIS) mission, launched on April 23, 2013, gathering a new snapshot of data every 1.3 seconds to track the properties of material over a wide range of temperatures in the complex solar atmosphere.

The sun's visible surface, called the photosphere, is some 6,000 Kelvins, while the corona regularly reaches temperatures which are 300 times as hot.

Jeff Brosius
"That's a bit of a puzzle," said Jeff Brosius, a space scientist at Catholic University in Washington, D.C., and NASA's Goddard Space Flight Center in Greenbelt, Maryland.

"Things usually get cooler farther away from a hot source. When you're roasting a marshmallow you move it closer to the fire to cook it, not farther away."

Brosius is the first author of a paper on these results appearing in the Aug. 1, 2014, edition of The Astrophysical Journal.

Several theories have been offered for how the magnetic energy coursing through the corona is converted into the heat that raises the temperature.

Different theories make different predictions about what kind of, and what temperature, material might be observable, but few observations have high enough resolution over a large enough area to distinguish between these predictions.


NASA's EUNIS sounding rocket mission spotted evidence to explain why the sun's atmosphere is so much hotter than its surface. 

Credit: NASA/Goddard/Duberstein 

The EUNIS sounding rocket, however, was equipped with a very sensitive version of an instrument called a spectrograph.

Spectrographs gather information about how much material is present at a given temperature, by recording different wavelengths of light.

To observe the extreme ultraviolet wavelengths necessary to distinguish between various coronal heating theories, such an instrument can only work properly in space, above the atmosphere surrounding Earth that blocks that ultraviolet light.

The EUNIS team stands in front of the sounding rocket before its second launch on Nov. 6, 2007. 

The mission will launch again for a six-minute flight to observe the sun on December 15, 2012. 

Credit: U.S. Navy

So EUNIS flew up nearly 200 miles above the ground aboard a sounding rocket, a type of NASA mission that flies for only 15 minutes or so, and gathered about six minutes worth of observations from above the planet's air.

During its flight, EUNIS scanned a pre-determined region on the sun known to be magnetically complex, a so-called active region, which can often be the source of larger flares and coronal mass ejections.

As light from the region streamed into its spectrograph, the instrument separated the light into its various wavelengths.

Instead of producing a typical image of the sun, the wavelengths with larger amounts of light are each represented by a vertical line called an emission line.

Each emission line, in turn, represents material at a unique temperature on the sun. Further analysis can identify the density and movement of the material as well.

The EUNIS spectrograph was tuned into a range of wavelengths useful for spotting material at temperatures of 10 million Kelvin; temperatures that are a signature of nanoflares.

Unlike a conventional image, NASA's Extreme Ultraviolet Normal Incidence Spectrograph will provide what's known as "spectra" such as above, which show lines to highlight which wavelengths of light are brighter than others. 

That information, in turn, corresponds to which elements are present in the sun's atmosphere and at what temperature. 

Credit: NASA/EUNIS

Scientists have hypothesised that a myriad of nanoflares could heat up solar material in the atmosphere to temperatures of up to 10 million Kelvins.

This material would cool very rapidly, producing ample solar material at the 1 to 3 million degrees regularly seen in the corona.

However, the faint presence of that extremely hot material should remain. Looking over their six minutes of data, the EUNIS team spotted a wavelength of light corresponding to that 10 million degree material.

To spot this faint emission line was a triumph of the EUNIS instrument's resolution. The spectrograph was able to clearly and unambiguously distinguish the observations representing the extremely hot material.

"The fact that we were able to resolve this emission line so clearly from its neighbours is what makes spectroscopists like me stay awake at night with excitement," said Brosius.

"This weak line observed over such a large fraction of an active region really gives us the strongest evidence yet for the presence of nanoflares."

The EUNIS experiment undergoing tests before launch. 

Credit: NASA

There are a variety of theories for what mechanisms power these impulsive bursts of heat, the nanoflares.

Moreover, other explanations have been offered for what is heating the corona.

Scientists will continue to explore these ideas further, gathering additional observations as their tools and instruments improve.

However, no other theory predicts material of this temperature in the corona, so this is a strong piece of evidence in favour of the nanoflare theory.

Adrian Daw
"This is a real smoking gun for nanoflares," said Adrian Daw, the current principal investigator for EUNIS at Goddard. "And it shows that these smaller, less expensive sounding rockets can produce truly robust science."

In addition to having a lower cost, sounding rockets offer a valuable test bed for new technology that may subsequently be flown on longer-term space missions.

Another advantage of sounding rockets is that the instruments parachute back to the ground so they can be recovered and re-used.

The EUNIS mission will be re-tuned to focus on a different set of solar wavelengths; ones that can also spot the extremely high temperature material representative of nanoflares, and fly again sometime in 2016.

More Information: Pervasive Faint Fe XIX Emission from a Solar Active Region Observed with EUNIS-13: Evidence for Nanoflare Heating - Jeffrey W. Brosius et al. 2014 ApJ 790 112. doi:10.1088/0004-637X/790/2/112

Friday, July 25, 2014

NASA SDO STEREO: Earth survived near-miss during 2012 solar storm

Photo released by Nasa Earth Observatory on June 7, 2011 and taken from Nasa's Solar Dynamics Observatory (SDO) shows the Sun unleashing a solar flare, radiation storm and a coronal mass ejection

Credit: NASA SDO

Back in 2012, the Sun erupted with a powerful solar storm that just missed the Earth but was big enough to "knock modern civilization back to the 18th century," NASA said.

The extreme space weather that tore through Earth's orbit on July 23, 2012, was the most powerful in 150 years, according to a statement posted on the US space agency website Wednesday.

However, few Earthlings had any idea what was going on.

"If the eruption had occurred only one week earlier, Earth would have been in the line of fire," said Daniel Baker, professor of atmospheric and space physics at the University of Colorado.

Instead the storm cloud hit the STEREO-A spacecraft, a solar observatory that is "almost ideally equipped to measure the parameters of such an event," NASA said.

Scientists have analyzed the treasure trove of data it collected and concluded that it would have been comparable to the largest known space storm in 1859, known as the Carrington event.

It also would have been twice as bad as the 1989 solar storm that knocked out power across Quebec, scientists said.

"I have come away from our recent studies more convinced than ever that Earth and its inhabitants were incredibly fortunate that the 2012 eruption happened when it did," said Baker.

The National Academy of Sciences has said the economic impact of a storm like the one in 1859 could cost the modern economy more than two trillion dollars and cause damage that might take years to repair.

Experts say solar storms can cause widespread power blackouts, disabling everything from radio to GPS communications to water supplies, most of which rely on electric pumps.

They begin with an explosion on the Sun's surface, known as a solar flare, sending X-rays and extreme UV radiation toward Earth at light speed.

Hours later, energetic particles follow and these electrons and protons can electrify satellites and damage their electronics.

Next are the coronal mass ejections, billion-ton clouds of magnetized plasma that take a day or more to cross the Sun-Earth divide.

These are often deflected by Earth's magnetic shield, but a direct hit could be devastating.

There is a 12 percent chance of a super solar storm the size of the Carrington event hitting Earth in the next 10 years, according to physicist Pete Riley, who published a paper in the journal Space Weather on the topic.

His research was based on an analysis of solar storm records going back 50 years.

"Initially, I was quite surprised that the odds were so high, but the statistics appear to be correct," said Riley.

"It is a sobering figure."

Tuesday, July 22, 2014

The sun has gone quiet: Sunspots and CME

The Sun by the Atmospheric Imaging Assembly of NASA's Solar Dynamics Observatory

Credit: NASA

The sun has gone quiet. Almost too quiet.

A few weeks ago it was teeming with sunspots, as you would expect since we are supposed to be in the middle of solar maximum-the time in the sun's 11-year cycle when it is the most active but now, there is hardly a sunspot in sight.

In an image taken Friday by NASA's Solar Dynamics Observatory, there is a tiny smidgen of brown just right of center where a small sunspot appears to be developing. But just one day before, there was nothing. It was a totally spotless day.

So what's going on here? Is the "All Quiet Event" as solar physicist Tony Phillips dubbed it, a big deal, or not?

"It is weird, but it's not super weird," said Phillips, who writes about solar activity on his web site SpaceWeather.com.

"To have a spotless day during solar maximum is odd, but then again, this solar maximum we are in has been very wimpy."

Phillips notes that this is the weakest solar maximum to have been observed in the space age, and it is shaking out to be the weakest one in the past 100 years, so the spotless day was not so totally out of left field.

"It all underlines that solar physicists really don't know what the heck is happening on the sun," Phillips said.

"We just don't know how to predict the sun, that is the take away message of this event."

Sunspots are interesting to solar observers because they are the region of the sun where solar activity such as solar flares (giant flashes of light) and coronal mass ejections (when material from the sun goes shooting off into space) originate.

They are caused by highly concentrated magnetic fields that are slightly cooler than the surrounding surface of the sun, which is why they appear dark to us.

Those intense magnetic fields can get twisted up and tangled, which causes a lot of energy to build up. Solar flares and coronal mass ejections occur when that energy is released in a very explosive way.

Alex Young, a heliophysicist at Goddard Space Flight Center, said it is hard to say what is and isn't unusual when it comes to the sun.

"We've only been observing the sun in lots of detail in the last 50 years," he said.

"That's not that long considering it's been around for 4.5 billion years." And it's not like astronomers have never seen the sun this quiet before.

Three years ago, on Aug. 14, 2011 it was completely free of sunspots and, as Phillips points out, that year turned out to have relatively high solar activity overall with several X-class flares.

So in that case, the spotless sun was just a "temporary intermission," as he writes on his web site.

Whether this quiet period will be similarly short-lived or if it will last longer remains to be seen.

"You just can't predict the sun," Phillips said.

Monday, June 16, 2014

NASA SOHO: Necklaces of solar activity

Back in 1998, the Sun was behaving as expected. The approximately 11-year cycle of activity was proceeding smoothly, heading towards a peak in 2001.

The Solar and Heliospheric Observatory (SOHO) captured this image on 9 November 1998 through its ultraviolet telescope, showing radiation from iron atoms bathed in a gas of around a million degrees Celsius.

This textbook image of solar activity shows two brighter bands circling the Sun at the same latitude in each hemisphere.

At visible wavelengths these bright loops and patches are associated with dark smudges known as sunspots.

They are produced when loops of magnetism become buoyant and rise from inside the Sun into the atmosphere.

When the cycle begins, the active regions appear at high latitudes in sparse numbers, disappearing after a few weeks or so.

As the cycle proceeds, new and often larger active regions appear more frequently at successively lower latitudes.

Many can be larger than Earth, and they sometimes persist for months.

This activity takes place in both hemispheres simultaneously, and about five or six years into the cycle sunspots reach lower latitudes closer to the equator. This is known as solar maximum.

After this, the number of spots begins to decline until they virtually disappear and the cycle starts again at high latitudes. It is one of the enduring mysteries of the Sun why this cycle happens.

Certainly, it is linked to the way the Sun generates magnetism deep inside its gaseous layers but the details remain elusive.

In recent years, the Sun has deviated from this textbook behaviour. The current cycle was about two years late in starting, the hemispheres are behaving differently and the peak of activity is relatively modest.

The next cycle is expected to continue in this new vein. It may even be weaker than the current cycle.

Monday, December 23, 2013

Solar activity not a key cause of climate change

A composite of space- and ground-based observations in different wavelengths gathered on the day of the solar eclipse of 3 November 2013. 

The result is an overall view of the Sun and its surrounding corona, extending far out into space.

Credit: SOHO

Climate change has not been strongly influenced by variations in heat from the sun, a new scientific study shows.

The findings overturn a widely held scientific view that lengthy periods of warm and cold weather in the past might have been caused by periodic fluctuations in solar activity.

Research examining the causes of climate change in the northern hemisphere over the past 1000 years has shown that until the year 1800, the key driver of periodic changes in climate was volcanic eruptions.

These tend to prevent sunlight reaching the Earth, causing cool, drier weather. Since 1900, greenhouse gases have been the primary cause of climate change.

The findings show that periods of low sun activity should not be expected to have a large impact on temperatures on Earth, and are expected to improve scientists' understanding and help climate forecasting.

Scientists at the University of Edinburgh carried out the study using records of past temperatures constructed with data from tree rings and other historical sources.

They compared this data record with computer-based models of past climate, featuring both significant and minor changes in the sun.

They found that their model of weak changes in the sun gave the best correlation with temperature records, indicating that solar activity has had a minimal impact on temperature in the past millennium.

The study, published in Nature Geoscience, was supported by the UK Natural Environment Research Council.

Dr Andrew Schurer, of the University of Edinburgh's School of GeoSciences, said: "Until now, the influence of the sun on past climate has been poorly understood.

We hope that our new discoveries will help improve our understanding of how temperatures have changed over the past few centuries, and improve predictions for how they might develop in future.

Links between the sun and anomalously cold winters in the UK are still being explored."

More information: Small influence of solar variability on climate over the past millennium, DOI: 10.1038/ngeo2040

Monday, April 8, 2013

Sunspot 1748 Makes it's Presence Known: Video


Sunspot 1748 had just begun its rotation to the Earthside of the Sun on April 5th and already has erupted twice. The first was a C2-class flare and a stronger M2-class flare occurred about 10 hours later. 

Credit: NASA / SDO /

Friday, January 4, 2013

NASA SDO Image: Solar Eruption

A solar eruption gracefully rose up from the sun on Dec. 31, 2012, twisting and turning. 

Magnetic forces drove the flow of plasma, but without sufficient force to overcome the sun’s gravity much of the plasma fell back into the sun.

The length of the eruption extends about 160,000 miles out from the Sun. 

With Earth about 7,900 miles in diameter, this relatively minor eruption is about 20 times the diameter of our planet.

› See video and relative size of Earth to eruption on 'Solar Ballet on the Sun' feature.

Image Credit: NASA/SDO

Saturday, October 13, 2012

Solar Prominence - Image

A section of the solar disk. The massive detached prominence was visible for hours.

Monday, October 1, 2012

Energetic Space Tornadoes hold the key to Solar Mystery

A team of European scientists has discovered super-hot and super-fast tornados on the Sun, which may help answer a number of outstanding questions in the realm of physics.

Writing in the journal Nature, they report that these `magnetic tornadoes reach speeds of up to 10,000 kilometres per hour, completely dwarfing anything found on Earth.

For images and videos visit www.solartornado.info 

In fact the fastest recorded tornado on Earth only reached speeds of approximately 486 km per hour, and was by no means an example of a common occurrence.

These magnetic tornadoes on the Sun, created by rotating magnetic field structures which force plasma to move in spirals, are not only common but may hold the answer to a long-standing physics conundrum: why the surface of the Sun is cooler than its outermost atmospheric layer.

Think of any fire and it is common knowledge (and sense) that the closer one gets to the fire, the hotter it gets.

The Sun however doesn't quite follow this logic. Its central core is an amazing 15,000,000 degrees Celsius and its surface cools to 5,500 degrees Celsius - following the logic that the further away, the cooler it gets.

The Sun cools to a mere 4,300 degrees Celsius to where a layer of the Sun's atmosphere, the photosphere, meets the chromosphere. In the chromosphere, however, things become topsy-turvy.

When the chromosphere begins to merge with the Sun's outermost atmospheric layer, the corona, the temperature rises to 100,000 degrees Celsius and continues to increase to a scorching 2,000,000 degrees Celsius in the part of the corona that is farthest from the Sun.

This, almost accordion-like sequence of heat, has puzzled many scientists. A puzzle which this recent discovery of magnetic tornadoes may have solved.

Professor Robertus Erdélyi, head of the Solar Physics and Space Plasma Research Centre (SP2RC) of the University of Sheffield's School of Mathematics and Statistics explains: 'One of the major problems in modern astrophysics is why the atmosphere of a star, like our own Sun, is considerably hotter than its surface?

Imagine, that you climb a mountain, e.g. a munro in the Scottish highlands, and it becomes hotter as you go higher and higher.

'It is understood that the energy originates from below the Sun's surface, but how this massive amount of energy travels up to the solar atmosphere surrounding it is a mystery.'

'We believe we have found evidence in the form of rotating magnetic structures - solar tornadoes - that channel the necessary energy in the form of magnetic waves to heat the magnetised solar plasma.'

'We report here the discovery of ubiquitous magnetic solar tornadoes and their signature in the hottest areas of the Sun's atmosphere where the temperature is a few millions of degree kelvin, about thousands of kilometres from the Sun's surface. This is a major step in the field.'

It is estimated that there are as many as 11,000 of these magnetic tornadoes above the Sun's surface at any time, and each one more than 1,600 km wide. Despite their number and size, they have never been seen until now.

Read the full article at EU CORDIS

Read more info on Space Tornadoes here at Institute of Theoretical Physics, University Oslo

Friday, September 7, 2012

Recent Solar Filament Creates Northern Lights over Canada [PHOTO]

Swirls of green and red appear in an aurora over Whitehorse, Yukon on the night of September 3, 2012. 

The aurora was due to the interaction of a coronal mass ejection (CME) from the sun with Earth's magnetosphere. 

The CME left the sun on August 31 and arrived on September 3.

Credit: David Cartier, Sr./NASA

Beautiful swirls of green and red lights appeared in the sky over Whitehorse, a town in the Canadian territory of Yukon, on the night of 3 September.

The lights were caused by a whip-like solar filament, ejected as a Coronal Mass Ejection (CME). The phenomenon did not connect with the Earth directly but glanced off the planet's magnetic environment, or magnetosphere.

The CME erupted on the surface of the Sun on 31 August and travelled towards Earth at a speed of more than 900 miles per second, according to NASA. In March 2010, a solar filament loop that erupted on the Sun's surface was as large as the circumference of the Earth.

The filament touched the magnetosphere a mere three days later - the distance between the planet and the Sun is roughly 149,785,000km - causing phenomenon called the Aurora Borealis (also known as the Northern Lights) to appear over Whitehorse.

Auroras are actually energy released in the form of colorful lights and are seen in skies at dusk.
 

Wednesday, September 5, 2012

NASA SDO Image: long filament of solar material - HD Video


A long filament erupted on the sun on August 31, 2012, shown here in a movie captured by NASA's Solar Dynamics Observatory (SDO) from noon EDT to 1:45 a.m. the next morning.

The filament lies in the lower left corner of the sun.

The movie shows light at 304 Angstroms and 171 Angstroms, both of which help scientists observe the sun's atmosphere, or corona.

A long filament of solar material that had been hovering in the sun's atmosphere, the corona, erupts out into space.

The coronal mass ejection, or CME, travelled at over 900 miles per second. 

The CME did not travel directly toward Earth, but did connect with Earth's magnetic environment, or magnetosphere, causing auroras to appear on the night of Monday, September 3.

Picture: NASA/GSFC/SDO / Rex Features

Friday, August 31, 2012

Solar filament extends over half a million miles

The sun isn't about just heat and fire. It's also about texture, variegated colours and occasional violent outbursts.

Here, a whip-like solar filament extends over half a million miles in a long arc above the sun’s surface.

Filaments are exceedingly hot ionized gasses that are magnetically anchored to the sun's photosphere.

Viewed against the blackness of space, they're very bright and are known as prominences.

Viewed with the sun itself as a backdrop, they appear darker since they're cooler than the overall solar mass. That more-modest appearance also earns them a more modest name.

A more recent and much larger Solar Filament eruption is shown below.

  This image was captured by the NASA SDO.

Thursday, August 30, 2012

SDO Image: Solar Activity in a new region - Helioviewer

There may be a new active region in town soon! An as of yet unnumbered region rotating almost into view released a series of small to moderate flares including a high C-class and an M1.3 solar flare. 

Credit: SDO, NOAA/GOES, helioviewer.org

The M flare produced a brief radio blackout. Once the region is more on the disk we will have to see if it produces any interesting events.

There is a nice sized filament sitting to the West of the region. The current activity is not considered high or of any concern. Just a region to keep an eye on.


Recent Solar flare recorded today.