Showing posts with label Cyclone. Show all posts

Wednesday, March 26, 2014

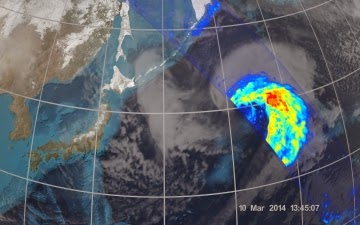
NASA JAXA GPM: First Images from GPM - Pacific Ocean Cyclone

NASA and the Japan Aerospace Exploration Agency (JAXA) have released the first images captured by their newest Earth-observing satellite, the Global Precipitation Measurement (GPM) Core Observatory, which launched into space Feb. 27.

The images show precipitation falling inside a March 10 cyclone over the northwest Pacific Ocean, approximately 1,000 miles east of Japan.


On March 10, the Core Observatory passed over an extra-tropical cyclone about 1,055 miles (1,700 kilometers) due east of Japan's Honshu Island. Satellite data shows the full range of precipitation in the storm.

Image Credit: NASA's Goddard Space Flight Center

Thursday, September 20, 2012

NASA: NOAA Arctic Cyclone Breaks Up Sea Ice


The storm cut off a large section of sea ice north of the Chukchi Sea and pushed it south to warmer waters that made it melt entirely. It also broke vast extensions of ice into smaller pieces more likely to melt.

NASA has released the following animation which shows how the winds of a large Arctic cyclone broke up the thinning sea ice cover of the Arctic Ocean in early August 2012.

According to NASA the storm likely contributed to the ice cap's shrinking to the smallest recorded extent in the past three decades.

The frozen cap of the Arctic Ocean likely reached its annual summertime minimum extent and broke a new record low on Sept. 16, the National Snow and Ice Data Center (NSIDC) at the University of Colorado in Boulder has reported.

Analysis of satellite data by NASA and the NASA-supported NSIDC showed that the sea ice extent shrunk to 1.32 million square miles (3.41 million square kilometers), or 293,000 square miles less than the previous lowest extent in the satellite record, set in mid-September, 2007.

Arctic Cyclone Breaks Up Sea Ice.

"Climate models have predicted a retreat of the Arctic sea ice; but the actual retreat has proven to be much more rapid than the predictions," said Claire Parkinson, a climate scientist at NASA Goddard Space Flight Center, Greenbelt, Md.

"There continues to be considerable inter-annual variability in the sea ice cover, but the long-term retreat is quite apparent."

This year, the cyclone formed off the coast of Alaska and moved on Aug. 5 to the center of the Arctic Ocean, where it churned the weakened ice cover for several days.

Dr. Claire L. Parkinson"The storm definitely seems to have played a role in this year's unusually large retreat of the ice," Parkinson said.

"But that exact same storm, had it occurred decades ago when the ice was thicker and more extensive, likely wouldn't have had as prominent an impact, because the ice wasn't as vulnerable then as it is now."

Sea ice data courtesy of the Defense Meteorological Satellite Program (DMSP). Wind data courtesy of the National Centers for Environmental Prediction (NCEP).

Visualization credit: Scientific Visualization Studio/NASA Goddard Space Flight Cente

Friday, June 15, 2012

Deep Depression over Britain

This MODIS weather satellite view of Britain, taken on 14 June 2012 at about 1.30pm, a shows a huge storm moving towards the south-west

Picture: MODIS

Friday, June 24, 2011

NASA Aqua Image: 2 Cyclones in one InfraRed Image

The Northwestern Pacific Ocean is active with two tropical cyclones today, Tropical Storm Meari near the Philippines, and Tropical Depression Haima moving over China and now toward Vietnam.


NASA's Aqua satellite passed over the region on June 22 and captured an infrared image of both storms in one image.

One of the instruments onboard NASA's Aqua satellite is the Atmospheric Infrared Sounder (AIRS).

AIRS captures cloud top temperatures in tropical cyclones to determine the strength of convection and thunderstorms.

The strongest thunderstorms have cloud tops with icy cold temperatures of -63F/-52C and are indicative of areas where rainfall rates could reach up to 2 inches / 50 mm per hour and both Meari and Haima had large areas of those very cold cloud top temperatures.

AIRS captured the image on June 22 at 17:53 UTC 1:53 p.m. EDT and it showed the heaviest rainfall and strongest convection (rapidly rising air that forms the thunderstorms that power a tropical cyclone) from Tropical Storm Meari is currently over the Philippine Sea and skirting the east coast of Luzon.

The imagery showed the large area of strong thunderstorms (and convection) in Haima mostly over the South China Sea and Hainan Island, China.

Haima is still a tropical depression as its maximum sustained winds on June 23 at 1500 UTC (11 a.m. EDT) were near 30 knots (34 mph/55 kmh). Tropical storms have maximum sustained winds between 38 and 73 mph.

It was located over Hainan Island, China, and about 235 nautical miles west-southwest of Hong Kong, China near 21.4 North and 109.6 East. Tropical Depression Haima is moving westward at 10 knots (11 mph/19 kmh).

Monday, February 14, 2011

NASA MODIS Image: Tropical Cyclone Bingiza: Madagascar

Tropical Cyclone Bingiza made landfall on Madagascar on February 14, 2011.

The U.S. Navy’s Joint Typhoon Warning Center (JTWC) reported that, as of about noon Madagascar time on February 14, Bingiza had maximum sustained winds of 85 knots (155 kilometers per hour) and gusts up to 105 knots (195 kilometers per hour).

The storm was located roughly 250 nautical miles (465 kilometers) northeast of Antananarivo.

The Moderate Resolution Imaging Spectroradiometer (MODIS) on NASA’s Terra satellite captured this natural-color image at 10:00 a.m. local time on February 13, 2011. Bingiza’s eye approaches northern Madagascar, and a spiral arm grazes Antananarivo.

Although Bingiza would weaken somewhat over land, the storm was expected to re-strengthen after passing over northern Madagascar, thanks to high sea surface temperatures. The JTWC forecast that, on the western side of Madagascar, the storm would travel southward, roughly tracing the island’s west coast.

Wednesday, February 2, 2011

NASA ISS Image: Tropical Cyclone Yasi

This image provided by NASA shows Tropical Cyclone Yasi as it approaches Queensland, Australia

Picture: NASA

Thursday, March 18, 2010

NASA: Modis Infrared satellite image of Cyclone Ului

Credit: NASA JPL, Ed Olsen

An infrared satellite image of Cyclone Ului on March 18 at 0247 UTC (10:47 p.m. March 17) clearly showed an eye, and strong, high, powerful thunderstorms (as cold as -63 Fahrenheit) around it.

Northeastern Queensland, Australia is on alert as Tropical Cyclone Ului continues tracking through the Coral Sea today, and is forecast to make a landfall on March 20. NASA's Terra and Aqua satellites have been providing satellite data on the storm to assist forecasters.

The Australian Bureau of Meteorology has issued a Tropical Cyclone Watch from Cardwell to Yeppoon in Queensland. There is also a High seas weather warning in effect for "metarea 10."

Ocean vessels can expect very high seas and have been asked to report conditions to the Bureau. Meanwhile the Solomon Islands have also posted a Tropical Cyclone Watch for Rennell/Bellona.

Read the full article here