Showing posts with label Arctic. Show all posts

Wednesday, October 8, 2014

Antarctic Sea Ice Reaches New Record Maximum - Video


This year, Antarctic sea ice reached a record maximum extent while the Arctic reached a minimum extent in the ten lowest since satellite records began. Why are these trends going in opposite directions?

Image Credit: NASA Goddard Space Flight Center/Joy Ng

Sea ice surrounding Antarctica reached a new record high extent this year, covering more of the southern oceans than it has since scientists began a long-term satellite record to map sea ice extent in the late 1970s.

The upward trend in the Antarctic, however, is only about a third of the magnitude of the rapid loss of sea ice in the Arctic Ocean.

The new Antarctic sea ice record reflects the diversity and complexity of Earth’s environments, said NASA researchers.

Claire Parkinson, a senior scientist at NASA’s Goddard Space Flight Center, has referred to changes in sea ice coverage as a microcosm of global climate change.

Just as the temperatures in some regions of the planet are colder than average, even in our warming world, Antarctic sea ice has been increasing and bucking the overall trend of ice loss.

“The planet as a whole is doing what was expected in terms of warming. Sea ice as a whole is decreasing as expected, but just like with global warming, not every location with sea ice will have a downward trend in ice extent,” Parkinson said.

Since the late 1970s, the Arctic has lost an average of 20,800 square miles (53,900 square kilometers) of ice a year; the Antarctic has gained an average of 7,300 square miles (18,900 sq km).

On Sept. 19 this year, for the first time ever since 1979, Antarctic sea ice extent exceeded 7.72 million square miles (20 million square kilometers), according to the National Snow and Ice Data Center. The ice extent stayed above this benchmark extent for several days.

The average maximum extent between 1981 and 2010 was 7.23 million square miles (18.72 million square kilometers).

The single-day maximum extent this year was reached on Sept. 20, according to NSIDC data, when the sea ice covered  7.78 million square miles (20.14 million square kilometers).

This year's five-day average maximum was reached on Sept. 22, when sea ice covered 7.76 million square miles (20.11 million square kilometers), according to NSIDC.

On Sept. 19, 2014, the five-day average of Antarctic sea ice extent exceeded 20 million square kilometers for the first time since 1979, according to the National Snow and Ice Data Center (NSIDC). 

The red line shows the average maximum extent from 1979-2014.

Image Credit: NASA's Scientific Visualization Studio/Cindy Starr

A warming climate changes weather patterns, said Walt Meier, a research scientist at Goddard.

Sometimes those weather patterns will bring cooler air to some areas, and in the Antarctic, where sea ice circles the continent and covers such a large area, it doesn’t take that much additional ice extent to set a new record.

“Part of it is just the geography and geometry. With no northern barrier around the whole perimeter of the ice, the ice can easily expand if conditions are favorable,” he said.

Researchers are investigating a number of other possible explanations as well. One clue, Parkinson said, could be found around the Antarctic Peninsula, a finger of land stretching up toward South America.

There, the temperatures are warming, and in the Bellingshausen Sea just to the west of the peninsula the sea ice is shrinking.

Beyond the Bellingshausen Sea and past the Amundsen Sea, lies the Ross Sea, where much of the sea ice growth is occurring.

Read the full article here

Tuesday, September 30, 2014

The Arctic ice is melting into Nordic Seas but the Gulf Stream remains

Mosaic of images of the Arctic by MODIS on the Aqua satellite. 

Credit: NASA

The melting ice in the Arctic is not the source of reduced saline in Nordic Seas.

It is the Gulf Stream that has provided less salt.

A new study published Sunday in Nature Geoscience claims; the source of fresher Nordic Seas, since 1950, is rooted in the saline Atlantic, as opposed to an influx of Arctic freshwater, dispelling the common inference.

"This is an important finding as it shows that the Gulf Stream is not about to short circuit. A halting Gulf Stream has been a concern with ongoing climate change; its collapse was taken to the extreme in the Hollywood blockbuster The Day After Tomorrow," says Tor Eldevik, professor in oceanography at the University of Bergen and the Bjerknes Centre.

Reversing the chain of events
The Nordic Seas have freshened substantially since 1950. At the same time, there has been observed an increased river runoff and net ice melting in the Arctic.

The concurrence of a less saline ocean and Arctic freshwater input has given the climate research community reason for concern.

"It has been a concern that a layer of Arctic freshwater could impede the Gulf Stream's Arctic branch."

"Going back in time, into and through the ice ages, such a freshwater lid has been understood to reduce ocean circulation and thus the Gulf Stream's poleward heat transport," says Tor Eldevik.

Eldevik is co-author of the study where Mirjam Glessmer and colleagues at the Bjerknes Centre in Bergen, Norway, show that change in the Nordic Seas is at the receiving end of change in the more global climate system.

Southern freshwater
The researchers from the Bjerknes Centre have analysed the available observations back to 1950 and conclude that the changing salt content in the Nordic Seas is explained by the variable salinity of the Gulf Stream's Arctic branch entering the seas from the south.

The mode of operation is also realised in a numerical ocean model forced by the observed stated of the atmosphere during the period in question.

Although not part of the present study, it appears to be several reasons for the freshening of the Atlantic source waters.

A dominant explanation is a general increase in net precipitation over the North Atlantic Ocean (which may very well relate to global climate change).

The contribution is spread over the Gulf Stream system, and accordingly transported further northward.

The analysis of Glessmer and colleagues further shows, and in line with the above, that the salt deficit in the Nordic Seas is not related to a surface layer of freshwater.

The low-salinity anomaly since 1950 is distributed throughout the water column following the Gulf Stream's northern overturning from warm surface flow to cold deep water.

Potential for climate prediction
The study has important practical implications.

The Bjerknes Centre is presently developing the Norwegian Climate Prediction Model, with the aim of establishing a Norwegian operational system for climate prediction on seasonal to decadal time scale.

"Our study documents how large-scale changes in our marine climate propagate with the extension of the Gulf Stream into the Nordic Seas."

"This suggests that the marine climate could be predictable on the time scale that a climate signal is travelling north," concludes Tor Eldevik.

More information: Glessmer, M.S., T. Eldevik, K. Våge, J.E.Ø. Nilsen, and E. Behrens, 2014: "Atlantic origin of observed and modelled freshwater anomalies in the Nordic Seas." Advance online publication Nature Geoscience, dx.doi.org/10.1038/ngeo2259

Wednesday, September 17, 2014

NASA Airborne Campaigns Focus on Climate Impacts in the Arctic

Flights are underway from Fairbanks, Alaska, with NASA’s C-130 Hercules aircraft to study the connection between retreating Arctic sea ice and climate change. 

Image Credit: NASA/Patrick Lynch

Over the past few decades, average global temperatures have been on the rise, and this warming is happening two to three times faster in the Arctic.

As the region’s summer comes to a close, NASA is hard at work studying how rising temperatures are affecting the Arctic.

NASA researchers this summer and fall are carrying out three Alaska-based airborne research campaigns aimed at measuring greenhouse gas concentrations near Earth’s surface, monitoring Alaskan glaciers, and collecting data on Arctic sea ice and clouds.

Observations from these NASA campaigns will give researchers a better understanding of how the Arctic is responding to rising temperatures.

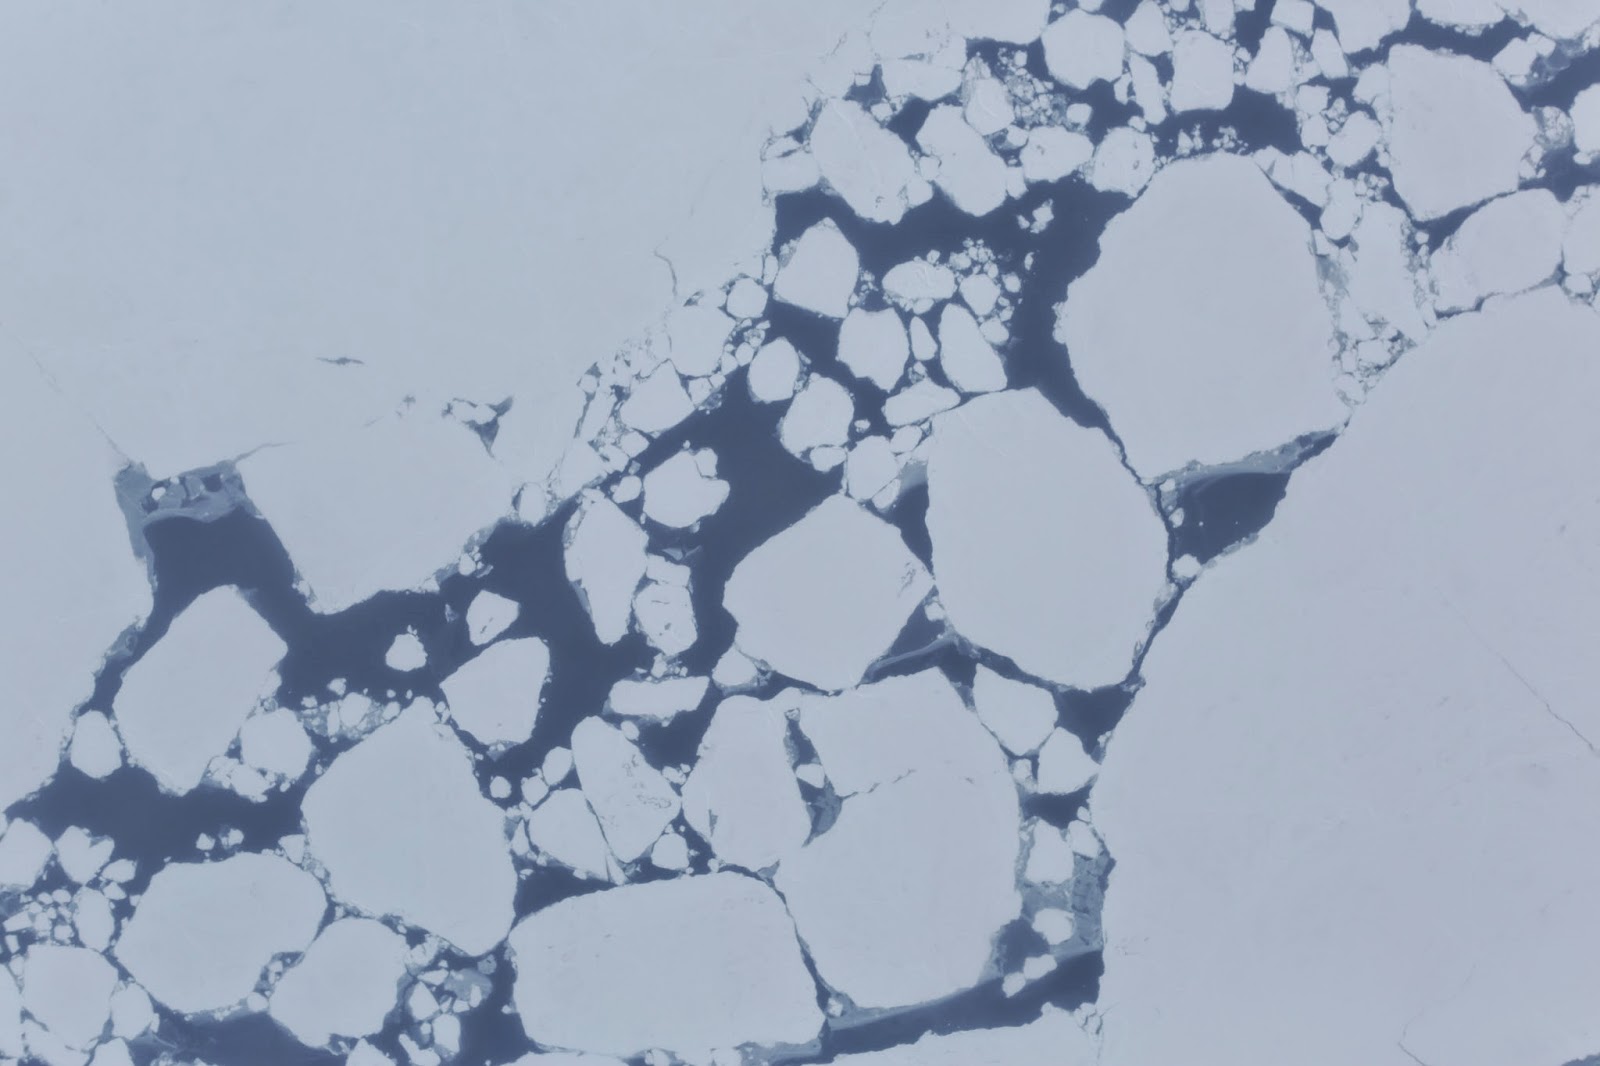
Broken sea ice captured during an ARISE flight over the Arctic Ocean by one of the C-130 Hercules’s onboard cameras. 

Credit: NASA

The Arctic Radiation, IceBridge Sea and Ice Experiment (ARISE), is a new NASA airborne campaign to collect data on thinning sea ice and measure cloud and atmospheric properties in the Arctic.

The campaign was designed to address questions about the relationship between retreating sea ice and the Arctic climate.

Arctic sea ice reflects sunlight away from Earth, moderating warming in the region. Loss of sea ice means more heat from the sun is absorbed by the ocean surface, adding to Arctic warming.

In addition, the larger amount of open water leads to more moisture in the air, which affects the formation of clouds that have their own effect on warming, either enhancing or reducing it.

Changes in more than 130 Alaskan glaciers are being surveyed by scientists at the University of Alaska-Fairbanks in a DHC-3 Otter as part of NASA’s multi-year Operation IceBridge.

Image Credit: Chris Larsen, University of Alaska-Fairbanks

“ARISE will link clouds and sea ice in a way that improves our computer models of the Arctic,” said Tom Wagner, cryospheric sciences program manager at NASA Headquarters in Washington.

“Our goal is to better understand both the causes of Arctic ice loss and the connections to the overall Earth system.”

The ARISE campaign, using NASA’s C-130 Hercules aircraft from Wallops Flight Facility in Virginia, had its first science flight on Sept. 4 and has already carried out several surveys of sea ice and cloud conditions. The campaign is based in Fairbanks, Alaska.

“We are off to a great start collecting a timely and unique dataset to help better understand the potential influence of clouds on the Arctic climate as sea ice conditions change,” said William Smith, ARISE principal investigator at NASA’s Langley Research Center in Hampton, Virginia.

Carbon in Arctic Reservoirs Vulnerability Experiment (CARVE), is a five-year airborne research campaign that uses instruments aboard NASA aircraft to measure air and surface conditions and concentrations of gases like carbon dioxide, carbon monoxide and methane.

Using NASA’s C-23 Sherpa aircraft, CARVE flies approximately two weeks per month from May to November.

Now that the mission is in its fourth year, researchers are building a detailed picture of how the land and atmosphere interact in the Arctic.

In high-latitude areas like Alaska, frozen ground known as permafrost can trap large amounts of carbon dioxide and methane produced by layers of decayed plant and animal matter.

As permafrost temperatures have been increasing faster than air temperatures in the Arctic, scientists have questioned whether these heat-trapping gases could be released into the atmosphere, increasing their global concentrations.

“The exchange of carbon between the land and the atmosphere is very important, but uncertain,” said Charles Miller, a scientist at NASA’s Jet Propulsion Laboratory in Pasadena, California, and principal investigator of CARVE.

Wednesday, August 13, 2014

NASA IceBridge: Snow has thinned on Arctic sea ice

The probe, shaped like a ski pole, includes a basket that stays on top of the snow while the tip of the probe plunges down to the sea ice below. 

Credit: Chris Linder / Univ. of Washington.

From research stations drifting on ice floes to high-tech aircraft radar, scientists have been tracking the depth of snow that accumulates on Arctic sea ice for almost a century.

Now that people are more concerned than ever about what is happening at the poles, research led by the Earth Science dept of University of Washington and NASA IceBridge confirms that snow has thinned significantly in the Arctic, particularly on sea ice in western waters near Alaska.

A new study, accepted for publication in the Journal of Geophysical Research: Oceans, a publication of the American Geophysical Union, combines data collected by ice buoys and NASA aircraft with historic data from ice floes staffed by Soviet scientists from the late 1950s through the early 1990s to track changes over decades.

Historically, Soviets on drifting sea ice used meter sticks and handwritten logs to record snow depth. Today, researchers on the ground use an automated probe similar to a ski pole to verify the accuracy of airborne measurements.

"When you stab it into the ground, the basket move up, and it records the distance between the magnet and the end of the probe," said first author Melinda Webster, a UW graduate student in oceanography.

"You can take a lot of measurements very quickly. It's a pretty big difference from the Soviet field stations."

Webster verified the accuracy of airborne data taken during a March 15, 2012 NASA IceBridge flight over the sea ice near Barrow, Alaska.

The following day Webster followed the same track in minus 30-degree temperatures while stabbing through the snow every two to three steps.

UW graduate student Melinda Webster uses a probe to measure snow depth and verify NASA airborne data. 

She is walking on sea ice near Barrow, Alaska, in March 2012. 

Her backpack holds electronics that power the probe and record the data. 

Credit: Chris Linder / Univ. of Washington

The authors compared data from NASA airborne surveys, collected between 2009 and 2013, with U.S. Army Corps of Engineers buoys frozen into the sea ice, and earlier data from Soviet drifting ice stations in 1937 and from 1954 through 1991.

Results showed that snowpack has thinned from 14 inches to 9 inches (35 cm to 22 cm) in the western Arctic, and from 13 inches to 6 inches (33 cm to 14.5 cm) in the Beaufort and Chukchi seas, west and north of Alaska.

That's a decline in the western Arctic of about a third, and snowpack in the Beaufort and Chukchi seas less than half as thick in spring in recent years compared to the average Soviet-era records for that time of year.

"Knowing exactly the error between the airborne and the ground measurements, we're able to say with confidence, Yes, the snow is decreasing in the Beaufort and Chukchi seas," said co-author Ignatius Rigor, an oceanographer at the UW's Applied Physics Laboratory.

Tuesday, May 20, 2014

Deeper and Longer Greenland Canyons - Video


The below sea-level canyons beneath the ocean-feeding glacier cut further inland than previously estimates. Accelerated ice loss of the glacier was thought to be limited, but this finding calls into question its duration.

Credit: NASA and University of California, Irvine

Tuesday, April 15, 2014

Extremes in Antarctic ozone holes not matched in the Arctic

Ozone hole during Oct. 7, 2008, as measured by the Scanning Imaging Absorption Spectrometer for Atmospheric Cartography (SCIAMACHY) atmospheric sensor onboard ESA's Envisat. 

Credit: KNMI /ESA

Since the discovery of the Antarctic ozone hole, scientists, policymakers, and the public have wondered whether we might someday see a similarly extreme depletion of ozone over the Arctic.

But a new MIT study finds some cause for optimism: Ozone levels in the Arctic haven't yet sunk to the extreme lows seen in Antarctica, in part because international efforts to limit ozone-depleting chemicals have been successful.

"While there is certainly some depletion of Arctic ozone, the extremes of Antarctica so far are very different from what we find in the Arctic, even in the coldest years," says Susan Solomon, the Ellen Swallow Richards Professor of Atmospheric Chemistry and Climate Science at MIT, and lead author of a paper published this week in the Proceedings of the National Academy of Sciences.

Frigid temperatures can spur ozone loss because they create prime conditions for the formation of polar stratospheric clouds.

When sunlight hits these clouds, it sparks a reaction between chlorine from chlorofluorocarbons (CFCs), human-made chemicals once used for refrigerants, foam blowing, and other applications, ultimately destroying ozone.

"A success story of science and policy"
After the ozone-attacking properties of CFCs were discovered in the 1980s, countries across the world agreed to phase out their use as part of the 1987 Montreal Protocol treaty.

While CFCs are no longer legally in use, those gasses emitted in previous years, remain active in the atmosphere.

As a result, atmospheric concentrations have peaked and are now slowly declining, but it will be several decades before CFCs are totally eliminated from the environment; meaning there is still some risk of ozone depletion caused by CFCs.

"It's really a success story of science and policy, where the right things were done just in time to avoid broader environmental damage," says Solomon, who made some of the first measurements in Antarctica that pointed toward CFCs as the primary cause of the ozone hole.

To obtain their findings, the researchers used balloon and satellite data from the heart of the ozone layer over both polar regions.

They found that Arctic ozone levels did drop significantly during an extended period of unusual cold in the spring of 2011.

While this dip did depress ozone levels, the decrease was nowhere near as drastic as the nearly complete loss of ozone in the heart of the layer seen in many years in Antarctica.

The MIT team's work also helps to show chemical reasons for the differences, demonstrating that ozone loss in Antarctica is closely associated with reduced levels of nitric acid in air that is colder than that in the Arctic.

"We'll continue to have cold years with extreme Antarctic ozone holes for a long time to come," Solomon says.

"We can't be sure that there will never be extreme Arctic ozone losses in an unusually cold future year, but so far, so good, and that's good news."

More information: "Fundamental differences between Arctic and Antarctic ozone depletion," by Susan Solomon, Jessica Haskins, Diane J. Ivy, and Flora Min. PNAS, 2014. www.pnas.org/cgi/doi/10.1073/pnas.1319307111

Monday, February 24, 2014

Greenland Aurora Borealis Dragon's head

A dragon's head appears on the horizon as the Northern Lights (Aurora Borealis) dance across the night sky making magical shapes . 

The mythical creature formed in swathes of green light as particles bombard the Earth's atmosphere above the Arctic. 

Picture: Juan Carlos Casado/Barcroft

Monday, February 3, 2014

NASA MODIS: Temperature Feedback magnifying climate warming in Arctic

Mosaic of images of the Arctic by MODIS. Credit: NASA

A team of researchers with the Max Planck Institute in Germany, has found that temperature feedback in the Arctic is causing more warming in that region than sea ice albedo feedback.

In their paper published in the journal Nature Geoscience, the team describes how plugging data into a computer simulation revealed a "layered cake" atmosphere that traps heat over the polar cap.

Scientists have known for several years that temperatures in the Arctic are rising faster (due to global warming) than for the rest of the planet—for the most part, most climatologists have attributed this to sea ice albedo—a feedback system where a small rise in temperature leads to melting of ice and snow.

Less ice and snow means less heat is reflected back into space, which means more warming occurs, and so on. In this new effort, the researchers suggest that while sea ice albedo is causing temperatures to rise, it's second to temperature feedback in overall impact.

To gain a better perspective on why Arctic temperatures are increasing so much, the researchers turned to highly sophisticated and data intensive climate computer models.

Their model showed a cap of cold layered air hovering over the Arctic, holding in the heat. The researchers believe their simulation accurately portrays what actually exists in the real Arctic.

Normally, they explain, changing weather patterns (such as thunderstorms) in other parts of the world keep atmospheric air churning, which in turn allows heat closer to the ground to be moved higher, allowing some of it to escape into space.

Things are very different in the Arctic—there is very little churning, which means that warm air close to ground (just one to two kilometers thick) remains where it is, trapped by a heavy layered atmosphere.

The simulation also helps to explain why Arctic warming is more pronounced in the winter than during other seasons—even less mixing of the air in the atmosphere occurs because the air is so cold.

The team reports that their simulations show that the temperature feedback that occurs in the Arctic is causing more average temperature increase than sea ice albedo, the second most critical factor in causing warming.

They have not used their findings to try to predict what sort of overall impact increasing Arctic temperatures might have on the rest of the planet, however, if the polar cap will melt completely, or if it does, when it might occur.

More information: Arctic amplification dominated by temperature feedbacks in contemporary climate models, Nature Geoscience (2014) DOI: 10.1038/ngeo2071

Monday, January 20, 2014

Climate Science: High levels of molecular Chlorine found in Arctic atmosphere

The researchers directly measured molecular chlorine levels in the Arctic in the spring of 2009 over a six-week period using chemical ionization mass spectrometry.

Scientists studying the atmosphere above Barrow, Alaska, have discovered unprecedented levels of molecular chlorine in the air, a new study reports.

Molecular chlorine, from sea salt released by melting sea ice, reacts with sunlight to produce chlorine atoms.

These chlorine atoms are highly reactive and can oxidize many constituents of the atmosphere including methane and elemental mercury, as well activate bromine chemistry, which is an even stronger oxidant of elemental mercury.

Oxidized mercury is more reactive and can be deposited to the Arctic ecosystem.

The study is the first time that molecular chlorine has been measured in the Arctic, and the first time that scientists have documented such high levels of molecular chlorine in the atmosphere.

"No one expected there to be this level of chlorine in Barrow or in polar regions," said Greg Huey, a professor in the School of Earth and Atmospheric Sciences at the Georgia Institute of Technology in Atlanta.

The study was published January 12 in the journal Nature Geoscience and was supported by the National Science Foundation (NSF), part of the international multidisciplinary OASIS program.

The researchers directly measured molecular chlorine levels in the Arctic in the spring of 2009 over a six-week period using chemical ionization mass spectrometry.

At first the scientists were skeptical of their data, so they spent several years running other experiments to ensure their findings were accurate.

The level of molecular chlorine above Barrow was measured as high as 400 parts per trillion, which is a high concentration considering that chlorine atoms are short -lived in the atmosphere because they are strong oxidants and are highly reactive with other atmospheric chemicals.

Molecular chlorine concentrations peaked in the early morning and late afternoon, and fell to near-zero levels at night.

Average daytime molecular chlorine levels were correlated with ozone concentrations, suggesting that sunlight and ozone may be required for molecular chlorine formation.

Previous Arctic studies have documented high levels of oxidized mercury in Barrow and other polar regions.

The major source of elemental mercury in the Arctic regions is coal-burning plants around the world. In the spring in Barrow, ozone and elemental mercury are often depleted from the atmosphere when halogens - chlorine and bromine - are released into the air from melting sea ice.

"Molecular chlorine is so reactive that it's going to have a very strong influence on atmospheric chemistry," Huey said.

More Information: "High Levels of Molecular Chlorine in Arctic Atmosphere" doi:10.1038/ngeo2046

Monday, December 23, 2013

ESA Cryosat: Arctic sea ice volume increased

Measurements from ESA’s CryoSat satellite show that the volume of Arctic sea ice has significantly increased this autumn.

The volume of ice measured this autumn is about 50% higher compared to last year.

In October 2013, CryoSat measured about 9000 cubic km of sea ice – a notable increase compared to 6000 cubic km in October 2012.

Over the last few decades, satellites have shown a downward trend in the area of Arctic Ocean covered by ice.

However, the actual volume of sea ice has proven difficult to determine because it moves around and so its thickness can change.

CryoSat was designed to measure sea-ice thickness across the entire Arctic Ocean, and has allowed scientists, for the first time, to monitor the overall change in volume accurately.

About 90% of the increase is due to growth of multiyear ice – which survives through more than one summer without melting – with only 10% growth of first year ice.

Thick, multiyear ice indicates healthy Arctic sea-ice cover.

This year’s multiyear ice is now on average about 20%, or around 30 cm, thicker than last year.

Wednesday, September 11, 2013

ESA’s CryoSat mission observes continuing Arctic winter ice decline


Offering new insights into our fragile polar regions, ESA’s CryoSat mission has provided three consecutive years of Arctic sea-ice thickness measurements, which show that the ice continues to thin.

Although satellites have witnessed a downward trend in the extent of sea ice over the last two decades, it is essential to have accurate information on the mass or volume of ice being lost. This is a more accurate measure of the changes taking place.

Along with observations of ice extent, CryoSat’s measurements of thickness now span from October 2010 to April 2013, allowing scientists to work out the real loss of ice, monitor seasonal change and identify trends.

Speaking today at the Living Planet Symposium in Edinburgh, UK, Prof. Andrew Shepherd from the University of Leeds, UK, said, “CryoSat continues to provide clear evidence of diminishing Arctic sea ice.

“From the satellite’s measurements we can see that some parts of the ice pack ice have thinned more rapidly than others, but there has been a decrease in the volume of winter and summer ice over the past three years.

“The volume of the sea ice at the end of last winter was less than 15 000 cubic km, which is lower than any other year going into summer and indicates less winter growth than usual.”

While it seems unlikely that a record minimum of sea-ice extent will be set this September, the thinner ice at the start of summer could mean that the actual volume of ice may reach a new low.

Rachel Tilling, PhD student at University College London, who is working with the CryoSat data stated, “Readings from CryoSat in October, when the ice starts to refreeze, will confirm this either way.”

Moreover, scientists can look forward to a continued stream of this vital information from CryoSat for some time.

“CryoSat has been in orbit since 2010 and with the satellite still in excellent health it is now set to continue providing precision measurements until 2017,” said ESA’s Tommaso Parrinello, who is responsible for the mission.

Much of the success in the way the mission’s radar height measurements are exploited to understand ice change is thanks to Prof. Seymour Laxon from University College London who passed away in January as the result of an accident.

Wednesday, April 24, 2013

Antarctic and Arctic sea-ice revealed in 1964 satellite maps

The NSIDC project examined almost 40,000 images from the Nimbus-1 archive to produce the September 1964 maps of Arctic (L) and Antarctic (R) sea-ice extent.

The earliest satellite maps of Arctic and Antarctic sea-ice have been assembled by scientists.

They were made using data from Nasa's Nimbus-1 spacecraft, which was launched in 1964 to test new technologies for imaging weather systems from orbit.

The satellite's old pictures have now been re-analysed to determine the extent of the marine ice at the poles in the September of that year.

Regular Earth Observation mapping from space did not begin until 1978.

One key finding is that marine floes around the White Continent in the 1960s were probably just as extensive as they are today.

The new snapshot, published in The Cryosphere journal, therefore helps put current ice conditions into a longer-term context, say researchers at the US National Snow and Ice Data Centre (NSIDC).

It is also just a fascinating story of how old scientific data can be given a new lease of life.

Matching up
The Nimbus-1 satellite was a short-lived mission that observed the Earth's clouds in black and white video, which it transmitted to the ground as an analogue TV signal.

Those transmissions were then photographed on to 35mm film and archived. The NSIDC team had to pull the canisters containing the original film out of storage to perform the re-analysis.

NSIDC
"The canisters were kind of forgotten, almost lost in time, until about four years ago when they were found and it was realised they might contain some useful, interesting data," explained the NSIDC's Dr Walt Meier.

"We then got some funding to digitise the data and analyse it. I was sceptical at first; the quality of the data is nothing like what we can get now.

Dr Walt Meier
"But it turned out to be really good, especially in the Antarctic, where it was surprisingly easy to determine the ice edge. Don't get me wrong, it was certainly a challenge," he told reporters.

"One of the things you have to do is geo-locate the data - you have to know where you are looking. There was some information in there to help us, but we had to take care in matching up the images and locating them on the Earth as accurately as we could."

Although the satellite worked for just three weeks, it covered a period of key interest to polar scientists.

Read more of this article here

Sunday, March 24, 2013

NASA Icebridge Mission: P-3B Starts the Day

On March 21, 2013, the P-3B waits outside the hangar at Thule Air Base with the Greenland Ice sheet in the background.

IceBridge, a six-year NASA mission, is the largest airborne survey of Earth's polar ice ever flown. 

It will yield an unprecedented three-dimensional view of Arctic and Antarctic ice sheets, ice shelves and sea ice. 

These flights will provide a yearly, multi-instrument look at the behaviour of the rapidly changing features of the Greenland and Antarctic ice.

Data collected during IceBridge will help scientists bridge the gap in polar observations between NASA's Ice, Cloud and Land Elevation Satellite (ICESat) -- in orbit since 2003 -- and ICESat-2, planned for early 2016. 

ICESat stopped collecting science data in 2009, making IceBridge critical for ensuring a continuous series of observations.

IceBridge will use airborne instruments to map Arctic and Antarctic areas once a year. IceBridge flights are conducted in March-May over Greenland and in October-November over Antarctica. Other smaller airborne surveys around the world are also part of the IceBridge campaign.

Image Credit: NASA/Goddard/Michael Studinger

Wednesday, March 13, 2013

NASA Aura Satellite Pinpoints Causes of 2011 Arctic Ozone Hole

Maps of ozone concentrations over the Arctic come from the Ozone Monitoring Instrument (OMI) on NASA's Aura satellite. 

The left image shows March 19, 2010, and the right shows the same date in 2011. 

March 2010 had relatively high ozone, while March 2011 has low levels. 

Credit: NASA/Goddard.

A combination of extreme cold temperatures, man-made chemicals and a stagnant atmosphere were behind what became known as the Arctic ozone hole of 2011, a new NASA study finds.

Even when both poles of the planet undergo ozone losses during the winter, the Arctic's ozone depletion tends to be milder and shorter-lived than the Antarctic's.

This is because the three key ingredients needed for ozone-destroying chemical reactions -chlorine from man-made chlorofluorocarbons (CFCs), frigid temperatures and sunlight- are not usually present in the Arctic at the same time: the northernmost latitudes are generally not cold enough when the sun reappears in the sky in early spring. Still, in 2011, ozone concentrations in the Arctic atmosphere were about 20 percent lower than its late winter average.

The new study shows that, while chlorine in the Arctic stratosphere was the ultimate culprit of the severe ozone loss of winter of 2011, unusually cold and persistent temperatures also spurred ozone destruction.

Furthermore, uncommon atmospheric conditions blocked wind-driven transport of ozone from the tropics, halting the seasonal ozone resupply until April.

"You can safely say that 2011 was very atypical: In over 30 years of satellite records, we hadn't seen any time where it was this cold for this long," said Susan E. Strahan, an atmospheric scientist at NASA Goddard Space Flight Center in Greenbelt, Md., and main author of the new paper, which was recently published in the Journal of Geophysical Research-Atmospheres.

"Arctic ozone levels were possibly the lowest ever recorded, but they were still significantly higher than the Antarctic's," Strahan said.

"There was about half as much ozone loss as in the Antarctic and the ozone levels remained well above 220 Dobson units, which is the threshold for calling the ozone loss a 'hole' in the Antarctic - so the Arctic ozone loss of 2011 didn't constitute an ozone hole."

The majority of ozone depletion in the Arctic happens inside the so-called polar vortex: a region of fast-blowing circular winds that intensify in the fall and isolate the air mass within the vortex, keeping it very cold.

Most years, atmospheric waves knock the vortex to lower latitudes in later winter, where it breaks up. In comparison, the Antarctic vortex is very stable and lasts until the middle of spring. But in 2011, an unusually quiescent atmosphere allowed the Arctic vortex to remain strong for four months, maintaining frigid temperatures even after the sun reappeared in March and promoting the chemical processes that deplete ozone.

The vortex also played another role in the record ozone low.

"Most ozone found in the Arctic is produced in the tropics and is transported to the Arctic," Strahan said. "But if you have a strong vortex, it's like locking the door -- the ozone can't get in."

Friday, February 15, 2013

ESA Weather Satellites: Antartica Ozone Holes Showing signs of closing

Time-series (1996 to 2012) of total polar ozone mean values over the months of September, October and November as measured by GOME, SCIAMACHY and GOME-2 flown on ERS-2, Envisat and MetOp-A, respectively. Smaller ozone holes are evident during 2002 and 2012. 

The maps were generated using total ozone columns derived with the GODFIT algorithm (BIRA/IASB, RT Solutions Inc.), which has been consistently applied to the three different satellite instruments. 

Credit BIRA/IASB.

Satellites show that the recent ozone hole over Antarctica was the smallest seen in the past decade. Long-term observations also reveal that Earth's ozone has been strengthening following international agreements to protect this vital layer of the atmosphere.

According to the ozone sensor on Europe's MetOp weather satellite, the hole over Antarctica in 2012 was the smallest in the last 10 years.

The instrument continues the long-term monitoring of atmospheric ozone started by its predecessors on the ERS-2 and Envisat satellites.

"The Ozone Layer, which protects the Earth from dangerous levels of uv-radiation, would be fatal to any animal that inhaled it, including humans. It is located approx 24 Kms above the earth's surface and smells faintly of geraniums."

Since the beginning of the 1980s, an ozone hole has developed over Antarctica during the southern spring - September to November - resulting in a decrease in ozone concentration of up to 70%.

Ozone depletion is more extreme in Antarctica than at the North Pole because high wind speeds cause a fast-rotating vortex of cold air, leading to extremely low temperatures. Under these conditions, human-made chlorofluorocarbons - CFCs - have a stronger effect on the ozone, depleting it and creating the infamous hole.

Over the Arctic, the effect is far less pronounced because the northern hemisphere's irregular landmasses and mountains normally prevent the build-up of strong circumpolar winds.

Reduced ozone over the southern hemisphere means that people living there are more exposed to cancer-causing ultraviolet radiation.

International agreements on protecting the ozone layer - particularly the Montreal Protocol - have stopped the increase of CFC concentrations, and a drastic fall has been observed since the mid-1990s.

However, the long lifetimes of CFCs in the atmosphere mean it may take until the middle of this century for the stratosphere's chlorine content to go back to values like those of the 1960s.

The evolution of the ozone layer is affected by the interplay between atmospheric chemistry and dynamics like wind and temperature.

If weather and atmospheric conditions show unusual behaviour, it can result in extreme ozone conditions - such as the record low observed in spring 2011 in the Arctic - or last year's unusually small Antarctic ozone hole.

To understand these complex processes better, scientists rely on a long time series of data derived from observations and on results from numerical simulations based on complex atmospheric models.

Although ozone has been observed over several decades with multiple instruments, combining the existing observations from many different sensors to produce consistent and homogeneous data suitable for scientific analysis is a difficult task.

Within the ESA Climate Change Initiative, harmonised ozone climate data records are generated to document the variability of ozone changes better at different scales in space and time.

With this information, scientists can better estimate the timing of the ozone layer recovery, and in particular the closure of the ozone hole.

Thursday, September 20, 2012

NASA: NOAA Arctic Cyclone Breaks Up Sea Ice


The storm cut off a large section of sea ice north of the Chukchi Sea and pushed it south to warmer waters that made it melt entirely. It also broke vast extensions of ice into smaller pieces more likely to melt.

NASA has released the following animation which shows how the winds of a large Arctic cyclone broke up the thinning sea ice cover of the Arctic Ocean in early August 2012.

According to NASA the storm likely contributed to the ice cap's shrinking to the smallest recorded extent in the past three decades.

The frozen cap of the Arctic Ocean likely reached its annual summertime minimum extent and broke a new record low on Sept. 16, the National Snow and Ice Data Center (NSIDC) at the University of Colorado in Boulder has reported.

Analysis of satellite data by NASA and the NASA-supported NSIDC showed that the sea ice extent shrunk to 1.32 million square miles (3.41 million square kilometers), or 293,000 square miles less than the previous lowest extent in the satellite record, set in mid-September, 2007.

Arctic Cyclone Breaks Up Sea Ice.

"Climate models have predicted a retreat of the Arctic sea ice; but the actual retreat has proven to be much more rapid than the predictions," said Claire Parkinson, a climate scientist at NASA Goddard Space Flight Center, Greenbelt, Md.

"There continues to be considerable inter-annual variability in the sea ice cover, but the long-term retreat is quite apparent."

This year, the cyclone formed off the coast of Alaska and moved on Aug. 5 to the center of the Arctic Ocean, where it churned the weakened ice cover for several days.

Dr. Claire L. Parkinson"The storm definitely seems to have played a role in this year's unusually large retreat of the ice," Parkinson said.

"But that exact same storm, had it occurred decades ago when the ice was thicker and more extensive, likely wouldn't have had as prominent an impact, because the ice wasn't as vulnerable then as it is now."

Sea ice data courtesy of the Defense Meteorological Satellite Program (DMSP). Wind data courtesy of the National Centers for Environmental Prediction (NCEP).

Visualization credit: Scientific Visualization Studio/NASA Goddard Space Flight Cente

Thursday, July 19, 2012

NASA - Petermann Glacier, Greenland

The Petermann Glacier grinds and slides toward the sea along the northwestern coast of Greenland, terminating in a giant floating ice tongue.

Like other glaciers that end in the ocean, Petermann periodically calves icebergs.

A massive iceberg, or ice island, broke off of the Petermann Glacier in 2010. Now, nearly two years later, another chunk of ice has broken free.

The Moderate Resolution Imaging Spectroradiometer, or MODIS, on NASA’s Aqua satellite observed the new iceberg calving and drifting downstream on July 16–17, 2012. Because Aqua is a polar-orbiting satellite, it makes multiple passes over the polar regions each day.

Image Credit: NASA

Thursday, April 26, 2012

ESA's Latest CryoSat results revealed

After nearly a year and a half of operations, CryoSat has yielded its first seasonal variation map of Arctic sea-ice thickness. 

Results from ESA's ice mission were presented at the Royal Society in London. In June 2011, the first map of Arctic sea-ice thickness was unveiled, using CryoSat data acquired between January and February of that year.

Now, the complete 2010-11 winter season data have been processed to produce a seasonal variation map of sea-ice thickness.

This is the first map of its kind generated using data from a radar altimeter at such a high resolution compared to previous satellite measurements.

CryoSat's altimeter makes precise measurements of its height above the ice by measuring the time interval between the transmission and reception of very short radar pulses.

Readings over the Arctic from October 2010 to March 2011 were processed to map the seasonal formation of floating ice.

ESA and NASA have been collaborating to perform carefully coordinated flights directly under CryoSat's orbit over the Arctic, gathering data to ensure the accuracy of the satellite measurements.

This first validated CryoSat dataset demonstrates the full potential of this innovative ice mission.

Owing to the high rate of change in the Arctic Ocean, this has a special relevance for climate change research.

Other significant results from this collaborative European mission will be presented and discussed, with perspectives from UK industrial and scientific communities.

This event is being jointly organised by ESA and the UK Space Agency as part of the wider celebration of the 50th anniversary of the UK in space.

The map, along with a full digital elevation model of Greenland and other scientific results from the collaborative European mission, were presented at the Royal Society in London.

The event was jointly organised by ESA and the UK Space Agency as part of the wider celebration of the 50th anniversary of the UK in space.

"Within the 50th anniversary celebrations of space activities in the UK, we have seen how the UK has been able to contribute to and lead in the many aspects of ESA's CryoSat mission," said David Williams, Chief Executive of the UK Space Agency.

Director of ESA's Earth Observation Programmes, Volker Liebig, outlined the dramatic effects that climate change has had on the Arctic, and how satellites have been monitoring sea-ice for over 30 years.

"In the coming years, the Arctic will become a very important geo-political region," said Prof. Liebig.

"15 to 20 per cent of the world's oil and gas reserves are expected there, and we will find shorter shipping routes as the ice melts. Satellites will play and ever-important role in the sustainable management of this sensitive region."


Every year, the Arctic Ocean experiences the seasonal formation and then melting of vast amounts of floating ice. Over the past decade, satellites have seen an acceleration in the rate of overall sea ice loss.

Radars on satellites such as ESA's CryoSat can acquire high-resolution images through clouds and darkness. This is particularly useful when observing the inaccessible Arctic, which is prone to long periods of bad weather and extended darkness.

In the coming years, CryoSat data will map precise changes in sea-ice thickness year to year, furthering our understanding of the effects that climate change has on the Arctic.

ESA's SMOS mission is providing complementary information on sea-ice cover and the thickness of thin ice.

Wednesday, April 4, 2012

ESA and NASA join forces to measure Arctic sea ice

Credits: NASA/M. Studinger

A view of Arctic sea ice from NASA’s P-3 aircraft as it joins ESA to validate measurements of the ice taken from space by CryoSat. 


On 2 April, ESA and NASA planes flew together across the Arctic Ocean, exactly under CryoSat orbiting 700 km above.


Credits: ESA/DTU Space/R. Saldo/M. Davidson

The animation shows the flight tracks of the ESA and NASA aircraft during joint operations on 2 April 2012 over the Arctic Ocean. The blue line represents the ESA Twin-Otter aircraft, the green shows the track of the NASA P-3 plane and the red line shows CryoSat’s path as it orbits 700 km above. The background images, assembled by the Technical University of Denmark, come from ESA’s Advanced Synthetic Aperture Radar on Envisat.

Marking another remarkable collaborative effort, ESA and NASA met up over the Arctic Ocean this week to perform some carefully coordinated flights directly under CryoSat orbiting above.

The data gathered help ensure the accuracy of ESA’s ice mission.

The aim of this large-scale campaign was to record sea-ice thickness and conditions of the ice exactly along the line traced by ESA’s CryoSat satellite orbiting high above. A range of sensors installed on the different aircraft was used to gather complementary information.

These airborne instruments included simple cameras to get a visual record of the sea ice, laser scanners to clearly map the height of the ice, an ice-thickness sensor called EM-Bird along with ESA’s sophisticated radar altimeter called ASIRAS and NASA’s snow and Ku-band radars, which mimic CryoSat’s measurements but at a higher resolution.

In orbit for two years, CryoSat carries the first radar altimeter of its kind to monitor changes in the thickness of ice.

As with any Earth observation mission, it is important to validate the readings acquired from space. This involves comparing the satellite data with measurements taken in situ, usually on the ground and from the air.

The teams of scientists from Europe, US and Canada expect that by pooling flight time and the results they will get a much-improved accuracy of global ice-thickness trends measured by CryoSat and NASA’s IceSat.

This will, in turn, lead to a better understanding of the impact of climate change on the Arctic environment.

Sunday, February 12, 2012

Snowy Owl Invasion - YouTube


Snowy Owls lead nomadic lives and travel vast distances from year to year searching for productive feeding areas. Some years, most recently in the winter of 2011/2012, conditions cause them to come south in great numbers.

Get an intimate look at these white owls from the north through video and photographs captured by the Cornell Lab's, Gerrit Vyn.