Showing posts with label Goddard. Show all posts

Thursday, November 21, 2013

NASA GEOS-5 Image: A Portrait of Global Winds

High-resolution global atmospheric modeling provides a unique tool to study the role of weather within Earth’s climate system. 

NASA’s Goddard Earth Observing System Model (GEOS-5) is capable of simulating worldwide weather at resolutions as fine as 3.5 kilometers.

This visualization shows global winds from a GEOS-5 simulation using 10-kilometer resolution. 

Surface winds (0 to 40 meters/second) are shown in white and trace features including Atlantic and Pacific cyclones.

Upper-level winds (250 hectopascals) are colored by speed (0 to 175 meters/second), with red indicating faster.

This simulation ran on the Discover supercomputer at the NASA Center for Climate Simulation

The complete 2-year “Nature Run” simulation—a computer model representation of Earth's atmosphere from basic inputs including observed sea-surface temperatures and surface emissions from biomass burning, volcanoes and anthropogenic sources—produces its own unique weather patterns including precipitation, aerosols and hurricanes. 

A follow-on Nature Run is simulating Earth’s atmosphere at 7 kilometers for 2 years and 3.5 kilometers for 3 months.

Image Credit: William Putman/NASA Goddard Space Flight Center

Wednesday, July 10, 2013

Evidence of Alien Planets? No, It's Just Gas

The Fomalhaut system contains a cleared ring (shining brightly in this image) in the dust around the star. 

Scientists suspect that this gap was cleared by a pair of terrestrial planets, but new research reveals that the presence of gas could also create such a breach.

CREDIT: NASA, ESA, and P. Kalas (University of California, Berkeley)

Ring-shaped gaps in the gas around a newborn star system can trick astronomers into thinking that baby planets are forming there when they actually aren't, scientists say.

New simulations show that a sufficient concentration of gas in the disk around a young star could cause the dust to clump together to form rings, creating paths that resemble those cleared by newly formed exoplanets.

Gravity binds dust and rock together. The small clumps collect more material as they travel, eventually clearing out rings in their systems that scientists say could host alien planets.

Wladimir Lyra
These systems make good targets in the ongoing search for new worlds. But imaging such planets is a challenge because the light reflecting from them can be as much as a billion times dimmer than the light from their parent star.

"Directly imaged planets are among the hardest to find," said Wladimir Lyra, of NASA's Jet Propulsion Laboratory. "One solution is that they may simply not be there."

Planting false evidence
Spinning disks of dust and gas give rise to newborn stars. After the stars are formed, the remaining materialcan continue to collapse to create new solar systems.

"Disks start as a mixture of usually 100 times more gas than dust," Lyra told reporters. "When the star is formed, its light will slowly evaporate the gas, taking around 10 million years to dissipate it completely."

Marc Kuchner
Lyra and colleague Marc Kuchner of NASA's Goddard Space Flight Center studied how the gas and dust within these disks might interact by creating two- and three-dimensional models of such systems.

"The dust heats the gas by the photoelectric effect — an effect explained by Albert Einstein back in 1905 in a landmark paper that eventually led to the development of quantum mechanics," Lyra said.

Tuesday, August 21, 2012

Dinosaur Footprint Found At NASA's Goddard Campus


Dinosaur tracker Ray Stanford describes the cretaceous-era nodosaur track he found on the Goddard Space Flight Center campus this year.

About 112 million years ago, a plant-eating dinosaur, known as nodosaur, roamed what is now NASA's Goddard Space Flight Center in Greenbelt, leaving a huge footprint in the Cretaceous mud that came to notice only this summer.

On Friday, Aug. 17, dinosaur tracker and paleontologist, Ray Stanford shared the location of the footprint, which the dinosaur made with its back left foot, with Goddard's facility management.

The footprint, sticking out of the grass, was similar to that of an elephant and was nearly 14 inches wide.

Although NASA officials accepted the discovery as an authentic dinosaur footprint for the time being, they said that they'd be calling in experts to confirm the find and search the area for other evidence.

"This was a large, armoured dinosaur," Stanford said. "Think of it as a four-footed tank. It was quite heavy, there's a quite a ridge or push-up here

Subsequently the sand was bound together by iron-oxide or hematite, so it gave us a nice preservation, almost like concrete." Stanford said that nodosaurs were like "four-footed tanks."

They grew thick, spiky armour knobbed with big "nodes." They used to browse vegetation and crouched down low to protect themselves from toothy attacks.

Stanford has had a number of papers published, which include the discovery of a new species of nodosaur from a fossilized hatchling that was found near the University of Maryland in College Park.

The nodosaur that made the huge footprint at Goddard probably belonged to the early Cretaceous period and could be 15 to 20 feet long.

The Cretaceous Period ran between 145.5 and 65.5 million years ago, and was the last period of the Mesozoic Era.

Stanford also identified and presented several smaller footprints - three-toed, flesh-eating therapods - to Goddard officials from the same site.

"Space scientists may walk along here, and they're walking exactly where this big, bungling heavy armoured dinosaur walked, maybe 110 to 112-million years ago," Stanford said.

Sunday, August 5, 2012

Shredded Star Heralds a New Era for Testing Relativity

This illustration highlights the principal features of Swift J1644+57 and summarizes what astronomers have discovered about it. Credit: NASA's Goddard Space Flight Center.

Last year, astronomers discovered a quiescent black hole in a distant galaxy that erupted after shredding and consuming a passing star. Now researchers have identified a distinctive X-ray signal observed in the days following the outburst that comes from matter on the verge of falling into the black hole.

This tell-tale signal, called a quasi-periodic oscillation or QPO, is a characteristic feature of the accretion disks that often surround the most compact objects in the universe - white dwarf stars, neutron stars and black holes.

QPOs have been seen in many stellar-mass black holes, and there is tantalizing evidence for them in a few black holes that may have middleweight masses between 100 and 100,000 times the sun's.

Until the new finding, QPOs had been detected around only one supermassive black hole - the type containing millions of solar masses and located at the centers of galaxies. That object is the Seyfert-type galaxy REJ 1034+396, which at a distance of 576 million light-years lies relatively nearby.

"This discovery extends our reach to the innermost edge of a black hole located billions of light-years away, which is really amazing.

"This gives us an opportunity to explore the nature of black holes and test Einstein's relativity at a time when the universe was very different than it is today," said Rubens Reis, an Einstein Postdoctoral Fellow at the University of Michigan in Ann Arbor.

Reis led the team that uncovered the QPO signal using data from the orbiting Suzaku and XMM-Newton X-ray telescopes, a finding described in a paper published today in Science Express.

The X-ray source known as Swift J1644+57 - after its astronomical coordinates in the constellation Draco - was discovered on March 28, 2011, by NASA's Swift satellite. It was originally assumed to be a more common type of outburst called a gamma-ray burst, but its gradual fade-out matched nothing that had been seen before.

Astronomers soon converged on the idea that what they were seeing was the aftermath of a truly extraordinary event - the awakening of a distant galaxy's dormant black hole as it shredded and gobbled up a passing star. The galaxy is so far away that light from the event had to travel 3.9 billion years before reaching Earth.

The star experienced intense tides as it reached its closest point to the black hole and was quickly torn apart. Some of its gas fell toward the black hole and formed a disk around it.

The innermost part of this disk was rapidly heated to temperatures of millions of degrees, hot enough to emit X-rays. At the same time, through processes still not fully understood, oppositely directed jets perpendicular to the disk formed near the black hole.

These jets blasted matter outward at velocities greater than 90 percent the speed of light along the black hole's spin axis. One of these jets just happened to point straight at Earth.

Nine days after the outburst, Reis, Strohmayer and their colleagues observed Swift J1644+57 using Suzaku, an X-ray satellite operated by the Japan Aerospace Exploration Agency with NASA participation. About ten days later, they then began a longer monitoring campaign using the European Space Agency's XMM-Newton observatory.

"Because matter in the jet was moving so fast and was angled nearly into our line of sight, the effects of relativity boosted its X-ray signal enough that we could catch the QPO, which otherwise would be difficult to detect at so great a distance," said Tod Strohmayer, an astrophysicist and co-author of the study at NASA's Goddard Space Flight Center in Greenbelt, Md.

As hot gas in the innermost disk spirals toward a black hole, it reaches a point astronomers refer to as the innermost stable circular orbit (ISCO). Any closer to the black hole and gas rapidly plunges into the event horizon, the point of no return.

The inward spiraling gas tends to pile up around the ISCO, where it becomes tremendously heated and radiates a flood of X-rays. The brightness of these X-rays varies in a pattern that repeats at a nearly regular interval, creating the QPO signal.

The data show that Swift J1644+57's QPO cycled every 3.5 minutes, which places its source region between 2.2 and 5.8 million miles (4 to 9.3 million km) from the center of the black hole, the exact distance depending on how fast the black hole is rotating.

To put this in perspective, the maximum distance is only about 6 times the diameter of our sun. The distance from the QPO region to the event horizon also depends on rotation speed, but for a black hole spinning at the maximum rate theory allows, the horizon is just inside the ISCO.

"QPOs send us information from the very brim of the black hole, which is where the effects of relativity become most extreme," Reis said. "The ability to gain insight into these processes over such a vast distance is a truly beautiful result and holds great promise."

Wednesday, July 25, 2012

NASA SDO Images: Colourful Mapping of Sun's Plasma - YouTube


According to NASA it's pure science and not art, but when Nicholeen Viall, a solar scientist at NASA's Goddard Space Flight Center created a new data visualization technique, the resulting solar images were reminiscent of an impressionist's painting.

Using raw solar data from NASA's Solar Dynamics Observatory (SDO) and needing to represent it in a understandable manner, researchers often visualize the data through graphs and images. In the case of Viall's new technique, the result was not just informative but beautiful.

According to NASA, Viall wanted to look at SDO's in a different perspective. "SDO's Atmospheric Imaging Assembly (AIA), constructed for NASA by Lockheed Martin, provides images of the sun in 10 different wavelengths, each approximately corresponding to a single temperature of material.

Therefore, when one looks at the wavelength of 171 Angstroms, for example, one sees all the material in the sun's atmosphere that is a million degrees Kelvin.

By looking at an area of the sun in different wavelengths, one can get a sense of how different swaths of material change temperature.

If an area seems bright in a wavelength that shows a hotter temperature an hour before it becomes bright in a wavelength that shows a cooler temperature, one can gather information about how that region has changed over time."

The technique involved using 12 hours of data representing the history of cooling and heating at a particular spot on the sun.

Each colour pixel represents a moment in that 12 hour period. NASA says that the heat history holds clues to the mechanisms that drive the temperature and movements of the sun's atmosphere.

The images Viall's created show that over a 12-hour period the material appears to be cooling. For there to be cooling there must have been heating going in the process as well.

But Viall's images don't show the steady heating expected. The conclusion is that the heating happens so quickly that it doesn't show up in the images.

According to NASA this supports those theories that say nanobursts of energy help heat the corona.

Monday, March 19, 2012

NASA: GPM's Dual-frequency Precipitation Radar

NASA Goddard receive Global Precipitation Measurement's (GPM) Dual-frequency Precipitation Radar from Japan's JAXA.

On Feb. 9, JAXA unveiled the dual frequency precipitation radar (DPR), which will be onboard the main satellite for the Global Precipitation Measurement (GPM) project.

A press conference was also held on the same day, and project personnel not only from JAXA, but also from the National Institute of Information and Communications Technology (NICT) and NASA explained the outline of the DPR and GPM main satellite.

They also described possible contributions from the GPM project to research elucidating climate and water circulation changes, improving weather forecast accuracy, and use in damage preparation caused by water and wind such as floods.

The DPR was transferred to NASA to be aboard the GPM main satellite. The satellite will be launched by the H-IIA Launch Vehicle from the Tanegashima Space Center.

Saturday, March 10, 2012

NASA Image: Aurora Borealis over Norðurljós March 2012

An aurora on March 8, 2012 shimmering over snow-covered mountains in Faskrudsfjordur, Iceland. 

Image courtesy of Jónína Óskarsdóttir.

You can find more about this image and the solar storm that sparked this display of the Northern Lights at www.nasa.gov/mission_pages/sunearth/news/News030712-X5-4....


Tuesday, January 24, 2012

NASA Video Shows Increase in Global Warming

Global temperatures have warmed significantly since 1880, the beginning of what scientists call the "modern record." 

At this time, the coverage provided by weather stations allowed for essentially global temperature data. 

As greenhouse gas emissions from energy production, industry and vehicles have increased, temperatures have climbed, most notably since the late 1970s. 

In this animation of temperature data from 1880-2011, reds indicate temperatures higher than the average during a baseline period of 1951-1980, while blues indicate lower temperatures than the baseline average. 

(Data source: NASA Goddard Institute for Space Studies. Visualization credit: NASA Goddard Space Flight Center Scientific Visualization Studio)

The global average surface temperature in 2011 was the ninth warmest since 1880, according to NASA scientists. The finding continues a trend in which nine of the 10 warmest years in the modern meteorological record have occurred since the year 2000.

NASA's Goddard Institute for Space Studies (GISS) in New York, which monitors global surface temperatures on an ongoing basis, released an updated analysis that shows temperatures around the globe in 2011 compared to the average global temperature from the mid-20th century.

The comparison shows how Earth continues to experience warmer temperatures than several decades ago. The average temperature around the globe in 2011 was 0.92 degrees F (0.51 C) warmer than the mid-20th century baseline.

"We know the planet is absorbing more energy than it is emitting," said GISS Director James E. Hansen. "So we are continuing to see a trend toward higher temperatures. Even with the cooling effects of a strong La Niña influence and low solar activity for the past several years, 2011 was one of the 10 warmest years on record."

The difference between 2011 and the warmest year in the GISS record (2010) is 0.22 degrees F (0.12 C). This underscores the emphasis scientists put on the long-term trend of global temperature rise. Because of the large natural variability of climate, scientists do not expect temperatures to rise consistently year after year. However, they do expect a continuing temperature rise over decades.

The first 11 years of the 21st century experienced notably higher temperatures compared to the middle and late 20th century, Hansen said. The only year from the 20th century in the top 10 warmest years on record is 1998.

Higher temperatures today are largely sustained by increased atmospheric concentrations of greenhouse gases, especially carbon dioxide. These gases absorb infrared radiation emitted by Earth and release that energy into the atmosphere rather than allowing it to escape to space. As their atmospheric concentration has increased, the amount of energy "trapped" by these gases has led to higher temperatures.

temperature graph While average global temperature will still fluctuate from year to year, scientists focus on the decadal trend. Nine of the 10 warmest years since 1880 have occurred since the year 2000, as the Earth has experienced sustained higher temperatures than in any decade during the 20th century. As greenhouse gas emissions and atmospheric carbon dioxide levels continue to rise, scientists expect the long-term temperature increase to continue as well. (Data source: NASA Goddard Institute for Space Studies. Image credit: NASA Earth Observatory, Robert Simmon)

The carbon dioxide level in the atmosphere was about 285 parts per million in 1880, when the GISS global temperature record begins. By 1960, the average concentration had risen to about 315 parts per million. Today it exceeds 390 parts per million and continues to rise at an accelerating pace.

The temperature analysis produced at GISS is compiled from weather data from more than 1,000 meteorological stations around the world, satellite observations of sea surface temperature and Antarctic research station measurements.

A publicly available computer program is used to calculate the difference between surface temperature in a given month and the average temperature for the same place during 1951 to 1980. This three-decade period functions as a baseline for the analysis.

The resulting temperature record is very close to analyses by the Met Office Hadley Centre in the United Kingdom and the National Oceanic and Atmospheric Administration's National Climatic Data Center in Asheville, N.C.

Hansen said he expects record-breaking global average temperature in the next two to three years because solar activity is on the upswing and the next El Niño will increase tropical Pacific temperatures. The warmest years on record were 2005 and 2010, in a virtual tie.

"It's always dangerous to make predictions about El Niño, but it's safe to say we'll see one in the next three years," Hansen said. "It won't take a very strong El Niño to push temperatures above 2010."

Saturday, January 21, 2012

Huge Solar Flare to engulf Earth


A long-duration solar flare that first erupted on the sun is heading towards Earth. The flare can disrupt long-range radio communications. On the other hand, it can create a beautiful display of the northern lights (aurora borealis) on Saturday.

Astronomers from NASA discovered the M-class, medium-sized solar flare erupting on the sun on Thursday, at 8:42 A.M. EST. Solar flares are classified into three types: X-class, M-class and C-class.

X flares are the biggest and can lead to radio blackouts, as well as having long-term radiation effects on Earth. M flares are medium-sized flares that affect the Earth's polar region. Finally, C-class flares are small-sized flares and are, usually, barely noticeable.

According to NASA's Space Weather Services, the solar flare is travelling at 630 miles per hour and it is likely to reach Earth on Saturday.

Wednesday, January 11, 2012

NASA - Hubble Solves Mystery on Source of Supernova in Nearby Galaxy

This image of Type Ia Supernova Remnant 0509-67.5 was made by combining data from two of NASA’s Great Observatories. 

The result shows soft green and blue hues of heated material from the X-ray data surrounded by the glowing pink optical shell, which shows the ambient gas being shocked by the expanding blast wave from the supernova.

Credit: NASA, ESA, and B. Schaefer and A. Pagnotta (Louisiana State University, Baton Rouge); Image Credit: NASA, ESA, CXC, SAO, the Hubble Heritage Team (STScI/AURA), J. Hughes (Rutgers University)

Based on previous observations from ground-based telescopes, astronomers knew the supernova class, called a Type Ia, created a remnant named SNR 0509-67.5, which lies 170,000 light-years away in the Large Magellanic Cloud galaxy.

Theoretically, this kind of supernova explosion is caused by a star spilling material onto a white dwarf companion, the compact remnant of a normal star, until it sets off one of the most powerful explosions in the universe.

Astronomers failed to find any remnant of the companion star, however, and concluded that the common scenario did not apply in this case, although it is still a viable theory for other Type Ia supernovae.

"We know Hubble has the sensitivity necessary to detect the faintest white dwarf remnants that could have caused such explosions," said lead investigator Bradley Schaefer of Louisiana State University (LSU) in Baton Rouge.

"The logic here is the same as the famous quote from Sherlock Holmes: 'when you have eliminated the impossible, whatever remains, however improbable, must be the truth.'"

The cause of SNR 0509-67.5 can be explained best by two tightly orbiting white dwarf stars spiraling closer and closer until they collided and exploded.

For four decades, the search for Type Ia supernovae progenitors has been a key question in astrophysics.

The problem has taken on special importance during the last decade with Type Ia supernovae being the premier tools for measuring the accelerating universe.

Type Ia supernovae release tremendous energy, in which the light produced is often brighter than an entire galaxy of stars.

The problem has been to identify the type of star system that pushes the white dwarf's mass over the edge and triggers this type of explosion.

Many possibilities have been suggested, but most require that a companion star near the exploding white dwarf be left behind after the explosion.

Therefore, a possible way to distinguish between the various progenitor models has been to look deep in the center of an old supernova remnant to search for the ex-companion star.

In 2010, Schaefer and Ashley Pagnotta of LSU were preparing a proposal to look for any faint ex-companion stars in the center of four supernova remnants in the Large Magellanic Cloud when they discovered the Hubble Space Telescope already had taken the desired image of one of their target remnants, SNR 0509-67.5, for the Hubble Heritage program, which collects images of especially photogenic astronomical targets.

In analyzing the central region, they found it to be completely empty of stars down to the limit of the faintest objects Hubble can detect in the photos. Schaefer suggests the best explanation left is the so-called "double degenerate model" in which two white dwarfs collide.

The results are being reported today at the meeting of the American Astronomical Society in Austin, Texas. A paper on the results will be published in the Jan. 12 issue of the journal Nature.

There are no recorded observations of the star exploding. However, researchers at the Space Telescope Science Institute in Baltimore, Md. have identified light from the supernova that was reflected off of interstellar dust, delaying its arrival at Earth by 400 years.

This delay, called a light echo of the supernova explosion also allowed the astronomers to measure the spectral signature of the light from the explosion. By virtue of the colour signature, astronomers were able to deduce it was a Type Ia supernova.

Because the remnant appears as a nice symmetric shell or bubble, the geometric center can be determined accurately.

These properties make SNR 0509-67.5 an ideal target to search for ex-companions. The young age also means that any surviving stars have not moved far from the site of the explosion.

The team plans to look at other supernova remnants in the Large Magellenic Cloud to further test their observations.

The Hubble Space Telescope is a project of international cooperation between NASA and the European Space Agency. NASA's Goddard Space Flight Center manages the telescope.

The Space Telescope Science Institute (STScI) conducts Hubble science operations. STScI is operated for NASA by the Association of Universities for Research in Astronomy, Inc., in Washington, D.C.

Monday, September 12, 2011

Fermi's Latest Gamma-ray Census Highlights Cosmic Mysteries

Active galaxies called blazars constitute the single largest source class in the second Fermi LAT catalog, but nearly a third of the sources are unassociated with objects at any other wavelength. Their natures are unknown.

Credit: NASA's Goddard Space Flight Center.

Every three hours, NASA's Fermi Gamma-ray Space Telescope scans the entire sky and deepens its portrait of the high-energy universe. Every year, the satellite's scientists reanalyze all of the data it has collected, exploiting updated analysis methods to tease out new sources. These relatively steady sources are in addition to the numerous transient events Fermi detects, such as gamma-ray bursts in the distant universe and flares from the sun.

Earlier this year, the Fermi team released its second catalog of sources detected by the satellite's Large Area Telescope (LAT), producing an inventory of 1,873 objects shining with the highest-energy form of light.

"More than half of these sources are active galaxies, whose massive black holes are responsible for the gamma-ray emissions that the LAT detects," said Gino Tosti, an astrophysicist at the University of Perugia in Italy and currently a visiting scientist at SLAC National Accelerator Laboratory in Menlo Park, Calif.

One of the scientists who led the new compilation, Tosti presented a paper on the catalog at a meeting of the American Astronomical Society's High Energy Astrophysics Division in Newport, R.I.

"What is perhaps the most intriguing aspect of our new catalog is the large number of sources not associated with objects detected at any other wavelength," he noted.

Indeed, if the Fermi catalog were a recipe, the two major ingredients would be active galaxies and pure mystery. To them, add in a pinch of pulsars, a dollop of supernova remnants, and a dash of other celestial objects, such as globular star clusters and galaxies like our own Milky Way.

Astronomers delight in the possibility of finding new types of gamma-ray-emitting objects within the "unassociated sources" that constitute roughly a third of the catalog. But Fermi's LAT is revealing gamma-rays from an increasing - and sometimes, surprising - variety of astronomical objects. To highlight the range of LAT discoveries, the Fermi team created the following "top ten" list of five sources within the Milky Way and five beyond our galaxy.

Friday, July 1, 2011

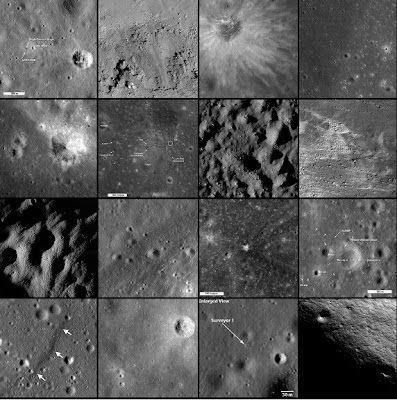
NASA Lunar Reconnaissance Orbiter: Sunrise on the Moon

On June 10, 2011, NASA's Lunar Reconnaissance Orbiter angled its orbit 65° to the west, allowing the spacecraft's cameras to capture a dramatic sunrise view of the moon's Tycho crater.

A very popular target with amateur astronomers, Tycho is located at 43.37°S, 348.68°E, and is about 51 miles (82 km) in diameter.

The summit of the central peak is 1.24 miles (2 km) above the crater floor. The distance from Tycho's floor to its rim is about 2.92 miles (4.7 km).

Tycho crater's central peak complex, shown here, is about 9.3 miles (15 km) wide, left to right (southeast to northwest in this view).

Image Credit: NASA/Goddard Space Flight Center/Arizona State University

Wednesday, June 22, 2011

NASA Chandra Image: Pandora’s Cluster — Clash of the Titans

Hubble image of Pandora's Cluster
A team of scientists studying the galaxy cluster Abell 2744, nicknamed Pandora’s Cluster, have pieced together the cluster’s complex and violent history.

They did this using space and ground based telescopes, including the Hubble Space Telescope, the European Southern Observatory’s Very Large Telescope, the Japanese Subaru telescope, and NASA’s Chandra X-ray Observatory.

The giant galaxy cluster appears to be the result of a simultaneous pile-up of at least four separate, smaller galaxy clusters.

The crash took place over a span of 350 million years.

The galaxies in the cluster make up less than 5 percent of its mass. The gas (around 20 percent) is so hot that it shines only in X-rays (colored red in this image). The distribution of invisible dark matter (making up around 75 percent of the cluster’s mass) is colored here in blue.

Dark matter does not emit, absorb, or reflect light, but it makes itself apparent through its gravitational attraction. To pinpoint the location of this elusive substance the team exploited a phenomenon known as gravitational lensing. This is the bending of light rays from distant galaxies as they pass through the gravitational field created by the cluster.

The result is a series of telltale distortions in the images of galaxies in the background of the Hubble and VLT observations. By carefully analyzing the way that these images are distorted, it is possible to accurately map where the dark matter lies.


Chandra mapped the distribution of hot gas in the cluster.
The data suggest that the complex collision has separated out some of the hot gas (which interacts upon collision) and the dark matter (which does not) so that they now lie apart from each other, and from the visible galaxies.

Near the core of the cluster there is a “bullet” shape where the gas of one cluster collided with that of another to create a shock wave. The dark matter passed through the collision unaffected.

In another part of the cluster, galaxies and dark matter can be found, but no hot gas. The gas may have been stripped away during the collision, leaving behind no more than a faint trail.

The Hubble Space Telescope is a project of international cooperation between NASA and the European Space Agency. NASA's Goddard Space Flight Center manages the telescope.

The Space Telescope Science Institute (STScI) conducts Hubble science operations. STScI is operated for NASA by the Association of Universities for Research in Astronomy, Inc., in Washington, D.C.

Friday, June 10, 2011

NASA's Voyager spacecraft on the edge of space

An artist's impression depicts the new view of the heliosphere in this image courtesy of NASA's Goddard Space Flight Centre.

Observations from NASA's Voyager spacecraft suggest the edge of our solar system may not be smooth, but filled with a turbulent sea of magnetic bubbles.

While using a new computer model to analyse Voyager data, scientists found the sun's distant magnetic field is made up of bubbles approximately 100 million miles wide. The bubbles are created when magnetic field lines reorganise.
Picture: REUTERS/NASA/Goddard Space Flight Centre

Thursday, April 7, 2011

NASA Telescopes Join Forces to Observe Unprecedented Explosion

NASA's Swift, Hubble Space Telescope and Chandra X-ray Observatory have teamed up to study one of the most puzzling cosmic blasts yet observed.

More than a week later, high-energy radiation continues to brighten and fade from its location.

Astronomers say they have never seen anything this bright, long-lasting and variable before.

Usually, gamma-ray bursts mark the destruction of a massive star, but flaring emission from these events never lasts more than a few hours.

Although research is ongoing, astronomers say that the unusual blast likely arose when a star wandered too close to its galaxy's central black hole. Intense tidal forces tore the star apart, and the infalling gas continues to stream toward the hole.

According to this model, the spinning black hole formed an outflowing jet along its rotational axis.

A powerful blast of X- and gamma rays is seen if this jet is pointed in our direction.

On March 28, Swift's Burst Alert Telescope discovered the source in the constellation Draco when it erupted with the first in a series of powerful X-ray blasts.

The satellite determined a position for the explosion, now cataloged as gamma-ray burst (GRB) 110328A, and informed astronomers worldwide.

As dozens of telescopes turned to study the spot, astronomers quickly noticed that a small, distant galaxy appeared very near the Swift position. A deep image taken by Hubble on April 4 pinpoints the source of the explosion at the center of this galaxy, which lies 3.8 billion light-years away.

That same day, astronomers used NASA's Chandra X-ray Observatory to make a four-hour-long exposure of the puzzling source.

The image, which locates the object 10 times more precisely than Swift can, shows that it lies at the centre of the galaxy Hubble imaged.

"We know of objects in our own galaxy that can produce repeated bursts, but they are thousands to millions of times less powerful than the bursts we are seeing now.

This is truly extraordinary," said Andrew Fruchter at the Space Telescope Science Institute in Baltimore.

"We have been eagerly awaiting the Hubble observation," said Neil Gehrels, the lead scientist for Swift at NASA's Goddard Space Flight Center in Greenbelt, Md. "The fact that the explosion occurred in the centre of a galaxy tells us it is most likely associated with a massive black hole. This solves a key question about the mysterious event."

More information here

Tuesday, October 19, 2010

NASA Hubble Image - Pinwheel of Star Birth

Though the universe is chock full of spiral-shaped galaxies, no two look exactly the same.

This face-on spiral galaxy, called NGC 3982, is striking for its rich tapestry of star birth, along with its winding arms.

The arms are lined with pink star-forming regions of glowing hydrogen, newborn blue star clusters, and obscuring dust lanes that provide the raw material for future generations of stars.

The bright nucleus is home to an older population of stars, which grow ever more densely packed toward the center.

NGC 3982 is located about 68 million light-years away in the constellation Ursa Major. The galaxy spans about 30,000 light-years, one-third of the size of our Milky Way galaxy.

This colour image is composed of exposures taken by the Hubble Space Telescope's Wide Field Planetary Camera 2 (WFPC2), the Advanced Camera for Surveys (ACS), and the Wide Field Camera 3 (WFC3).

The observations were taken between March 2000 and August 2009. The rich color range comes from the fact that the galaxy was photographed invisible and near-infrared light.

Also used was a filter that isolates hydrogen emission that emanates from bright star-forming regions dotting the spiral arms.

The Hubble Space Telescope is a project of international cooperation between NASA and the European Space Agency. NASA's Goddard Space Flight Center manages the telescope.

The Space Telescope Science Institute (STScI) conducts Hubble science operations. STScI is operated for NASA by the Association of Universities for Research in Astronomy, Inc. in Washington, D.C.

Credit: NASA, ESA, and the Hubble Heritage Team (STScI/AURA)

Acknowledgment: A. Riess (STScI)

Sunday, October 18, 2009

Goddard's LVIS (Laser Vegetation Imaging Sensor) instrumentation

Goddard's LVIS (Laser Vegetation Imaging Sensor) instrumentation ready to load into the DC-8 at Dryden Aircraft Operations Facility.