Showing posts with label measurement. Show all posts

Tuesday, September 30, 2014

Europe's SSTL new ocean winds and waves measuring method - video


The video shows in about 20 times real time speed the motion of the TechDemoSat-1 satellite over an orbit, indicated by a white cross on the world map. 

The specular reflections targeted by the SGR-ReSI are shown by yellow spots, and the measurement tracks are shown in yellow. 

The four Delay Doppler Map channels from the SGR-ReSI are shown at the top right. The spreading horseshoe shape is caused by reflections being received away from the specular point, and a rougher ocean causes more spreading. 

When reflections are received from over land and over ice, there is much less spreading. 

The red band on the map indicates the collection of “raw” unprocessed data, which takes a few minutes to transfer before the processed Delay Doppler Maps resume.

Credit: SSTL

Surrey Satellite Technology Ltd (SSTL) has successfully demonstrated an innovative method of measuring winds and waves from space, using GNSS Reflectometry.

This paves the way for a cost effective satellite system supporting the maritime sector and the organisations that rely on this information and it also offers improvements to weather services and climate research.

The measurements were taken from an instrument developed by SSTL, the SGR-ReSI, (Space GNSS Receiver Remote Sensing Instrument) which is flying on-board TechDemoSat-1, a technology demonstration satellite which was launched in July 2014.

TechDemoSat-1
SSTL's SGR-ReSI collects the signals from GPS and other navigation satellites after they have been reflected off the ocean surface and processes them into images called Delay Doppler Maps, from which ocean roughness and wind speed measurements at the sea surface can be interpreted.

The technique works in a similar way to existing scatterometric radar from satellites, however it eliminates the need for a transmitter and can process up to four reflections from different GPS satellites simultaneously, presenting an opportunity for collecting data more regularly and in a denser grid across the globe.

By flying the receivers on a constellation of small satellites GNSS Reflectometry data could be used to map all of the Earth's ocean surface with refreshed data every couple of hours.

This would be of enormous benefit to the maritime industry who depend on wave height and wind speed predictions for optimum ship routing, insurance claims, oil and gas rig operations, undersea cable laying and fishing conditions.

Such wind speed and wave height measurements are currently very difficult to make over the open ocean in timely manner and in a dense enough grid to be useful.

Luis Gomes, Director of Earth Observation and Science at SSTL, commented: "We are very excited about the future application of this development which extends the applications of small satellites.

"For instance, a constellation of 18 SGR-ReSIs could cover most of the world's oceans every few hours providing a real time wind and wave height service."

"These do not need to be dedicated satellites as the SGR-ReSI can be easily accommodated as a hosted payload on small satellites with a different primary mission. Our aim is to deploy such a constellation in the next two years."

The SGR-ReSI can pick up GPS reflections not only off the ocean, but also off land, snow and ice, opening up other potential new opportunities for remote sensing - for example, measuring the thickness of sea ice, snow depth, soil moisture levels and the classification of vegetative foliage.

SSTL, supported by the European Space Agency, is now working on preparing the ground processing and web interface that will allow users access to the measurements over the internet with a short delay.

Tuesday, August 19, 2014

Exoplanet measured with remarkable precision

Barely 30 years ago, the only planets astronomers had found were located right here in our own solar system.

The Milky Way is chock-full of stars, millions of them similar to our own sun. Yet the tally of known worlds in other star systems was exactly zero.

What a difference a few decades can make.

As 2014 unfolds, astronomers have not only found more than a thousand "exoplanets" circling distant suns, but also they're beginning to make precise measurements of them.

The old void of ignorance about exoplanets is now being filled with data precise to the second decimal place.

A team led by Sarah Ballard, a NASA Carl Sagan Fellow at the University of Washington in Seattle, recently measured the diameter of a "super Earth" to within an accuracy of 148 miles total or about 1 percent, remarkable accuracy for an exoplanet located about 300 light years from Earth.

"It does indeed seem amazing," says Ballard. "The landscape of exoplanet research has changed to an almost unrecognizable degree since I started graduate school in 2007."

To size up the planet, named "Kepler 93 b," Ballard used data from NASA's Kepler and Spitzer Space Telescopes.

First, Kepler discovered the planet. As seen from Earth, Kepler 93 b passes directly in front of its parent star, causing the starlight to dim during the transit.

That dimming, which occurs once per orbit, is what allowed Kepler mission scientists to find the planet in the first place.

Kepler Space Telescope
Next, both Spitzer and Kepler Space Telescope recorded multiple transits at visible and infrared wavelengths.

Data from the observatories agreed: Kepler 93 b was really a planet and not some artefact of stellar variability.

Ballard then knew that by looking carefully at the light curve she could calculate the size of the planet relative to the star.

At that point, the only missing piece was the diameter of the star itself.

"The precision with which we measured the size of the planet is linked directly to our measurement of the star," says Ballard. "And we measured the star using a technique called astero-seismology."

Most people have heard of "seismology," the study of seismic waves moving through the Earth. "We can learn a lot about the structure of our planet by studying seismic waves," she says.

Asteroseismology is the same thing, except for stars: The outer layers of stars boil like water on top of a hot stove. Those convective motions create seismic waves that bounce around inside the core, causing the star to ring like an enormous bell. Kepler can detect that "ringing," which reveals itself as fluctuations in a star's brightness.

Ballard's colleague, University of Birmingham professor Bill Chaplin led the asteroseismic analysis for Kepler-93 b.

"By analyzing the seismic modes of the star, he was able to deduce its radius and mass to an accuracy of a percent," she says.

The new measurements confirm that Kepler-93 b is a "super-Earth" sized exoplanet, with a diameter about one-and-a-half times the size of our planet.

Previous measurements by the Keck Observatory in Hawaii had put Kepler-93 b's mass at about 3.8 times that of Earth.

The density of Kepler-93 b, derived from its mass and newly obtained radius, suggests the planet is very likely made of iron and rock, like Earth itself.

Although super-Earths are common in the galaxy, none exist in our solar system. That makes them tricky to study.

Ballard's team has shown, however, that it is possible to learn a lot about an exoplanet even when it is very far away.

Wednesday, July 9, 2014

Record levels of solar ultraviolet measured in Bolivian Andes, South America

A team of researchers in the U.S. and Germany has measured the highest level of ultraviolet radiation ever recorded on the Earth's surface.

The extraordinary UV fluxes, observed in the Bolivian Andes only 1,500 miles from the equator, are far above those normally considered to be harmful to both terrestrial and aquatic life.

The results are being published in the open-access journal Frontiers in Environmental Science.

"These record-setting levels were not measured in Antarctica, where ozone holes have been a recurring problem for decades," says team leader Nathalie A. Cabrol of the SETI Institute and NASA Ames Research Center. "This is in the tropics, in an area where there are small towns and villages."

The measurements were made in the southern hemisphere summer of 2003 and 2004, using instruments developed for the European Light Dosimeter Network (Eldonet).

They were undertaken as Cabrol's team was investigating high altitude Andean lakes as part of an astrobiology study of Mars-like environments.

Dosimeters were deployed on the summit of the towering Licancabur volcano (altitude: 5,917 meters) and at nearby Laguna Blanca (altitude 4,340 meters).

The combination of a midday sun near the zenith, as well as the high elevation of these sites, produces higher irradiance levels because of naturally low ozone in such locations. But these intensities of short-wavelength UV-B radiation (280 – 315 nm) are unprecedented.

"A UV index of 11 is considered extreme, and has reached up to 26 in nearby locations in recent years," notes Cabrol.

"But on December 29, 2003, we measured an index of 43. If you're at a beach in the U.S., you might experience an index of 8 or 9 during the summer, intense enough to warrant protection. You simply do not want to be outside when the index reaches 30 or 40."

The intense radiation coincided with other circumstances that may have increased the UV flux, including ozone depletion by increased aerosols from both seasonal storms and fires in the area.

In addition, a large solar flare occurred just two weeks before the highest UV fluxes were registered.

Ultraviolet spikes continued to occur, albeit at lower intensity, throughout the period of solar instability, and stopped thereafter.

While the evidence linking the solar event to the record-breaking radiation is only circumstantial, particles from such flares are known to affect atmospheric chemistry and may have increased ozone depletion.

"While these events are not directly tied to climate change, they are sentinels of what could occur if ozone thins globally," Cabrol says.

"The thinner and more unstable the ozone, the more prone we will be to this kind of event."

High UV-B exposure negatively affects the entire biosphere, not just humans. It damages DNA, affects photosynthesis, and decreases the viability of eggs and larvae. For these reasons, it is important to keep a close watch on UV flux levels.

"While this unsettling record might be the result of a 'perfect storm' of events, it could happen again," says Cabrol, "because the factors that caused it are not rare."

David Black
"What we need is more monitoring of the ozone changes in these areas. These fluxes, which are comparable to those of early Mars, are occurring in a populated area."

David Black, president and CEO of the SETI Institute, notes that "this is an excellent example of how astrobiology, which includes understanding the atmospheres of other planets, is germane to contemporary concerns here on Earth."

More information: Record Solar UV Irradiance in the Tropical Andes, Frontiers in Environmental Science, DOI: 10.3389/fenvs.2014.00019

Thursday, April 10, 2014

Hubble extends stellar tape measure 10 times farther into space

By applying a technique called spatial scanning to an age-old method for gauging distances called astronomical parallax, scientists now can use NASA’s Hubble Space Telescope to make precision distance measurements 10 times farther into our galaxy than previously possible. 

Credit: NASA /ESA, A.Feild /STScI

Using NASA’s Hubble Space Telescope, astronomers now can precisely measure the distance of stars up to 10,000 light-years away—10 times farther than previously possible.

Astronomers have developed yet another novel way to use the 24-year-old space telescope by employing a technique called spatial scanning, which dramatically improves Hubble's accuracy for making angular measurements.

The technique, when applied to the age-old method for gauging distances called astronomical parallax, extends Hubble's tape measure 10 times farther into space.

"This new capability is expected to yield new insight into the nature of dark energy, a mysterious component of space that is pushing the universe apart at an ever-faster rate," said Noble laureate Adam Riess of the Space Telescope Science Institute (STScI) in Baltimore, Md.

Parallax, a trigonometric technique, is the most reliable method for making astronomical distance measurements, and a practice long employed by land surveyors here on Earth.

The diameter of Earth's orbit is the base of a triangle and the star is the apex where the triangle's sides meet.

The lengths of the sides are calculated by accurately measuring the three angles of the resulting triangle.

Astronomical Parallax works reliably well for stars within a few hundred light-years of Earth.

For example, measurements of the distance to Alpha Centauri, the star system closest to our sun, vary only by one arc second.

This variance in distance is equal to the apparent width of a dime seen from two miles away.

This illustration shows how the precision stellar distance measurements from NASA’s Hubble Space Telescope have been extended 10 times farther into our Milky Way galaxy than possible previously. 

This greatly extends the volume of space accessible to refining the cosmic yardstick needed for measuring the size of the universe. 

This most solid type of measurement is based on trigonometric Parallax, which is commonly used by surveyors. 

Because the stars are vastly farther away than a surveyor's sightline, Hubble must measure extremely small angles on the sky. 

Credit: NASA, ESA, and A. Feild (STScI)

Stars farther out have much smaller angles of apparent back-and-forth motion that are extremely difficult to measure.

Astronomers have pushed to extend the parallax yardstick ever deeper into our galaxy by measuring smaller angles more accurately.

This new long-range precision was proven when scientists successfully used Hubble to measure the distance of a special class of bright stars called Cepheid variables, approximately 7,500 light-years away in the northern constellation Auriga.

The technique worked so well, they are now using Hubble to measure the distances of other far-flung Cepheids.

Such measurements will be used to provide firmer footing for the so-called cosmic "distance ladder."

This ladder's "bottom rung" is built on measurements to Cepheid variables stars that, because of their known brightness, have been used for more than a century to gauge the size of the observable universe.

They are the first step in calibrating far more distant extra-galactic milepost markers such as Type Ia supernovae.

Riess and the Johns Hopkins University in Baltimore, Md., in collaboration with Stefano Casertano of STScI, developed a technique to use Hubble to make measurements as small as five-billionths of a degree.

To make a distance measurement, two exposures of the target Cepheid star were taken six months apart, when Earth was on opposite sides of the sun.

A very subtle shift in the star's position was measured to an accuracy of 1/1,000 the width of a single image pixel in Hubble's Wide Field Camera 3, which has 16.8 megapixels total.

A third exposure was taken after another six months to allow for the team to subtract the effects of the subtle space motion of stars, with additional exposures used to remove other sources of error.

Saturday, March 1, 2014

NASA-JAXA GPM Launch: Mission to Measure Global Rain, Snow

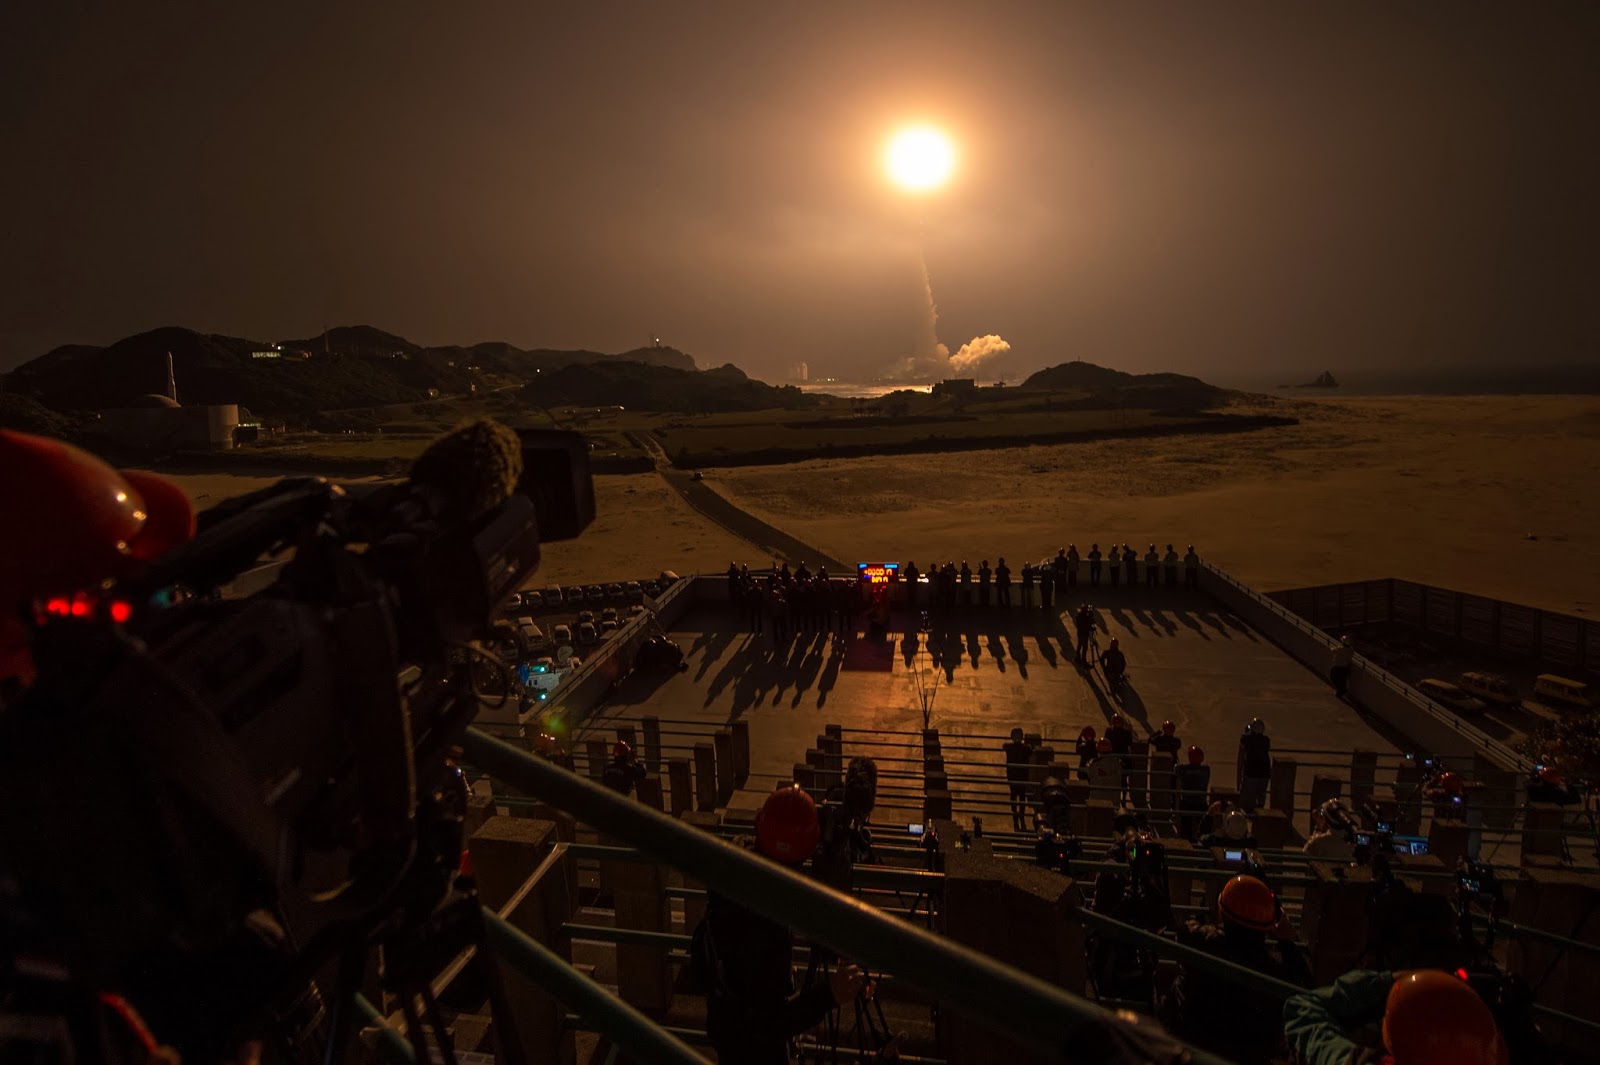
A Japanese H-IIA rocket with the NASA-Japan Aerospace Exploration Agency (JAXA) Global Precipitation Measurement (GPM) Core Observatory onboard, is seen launching from the Tanegashima Space Center in Tanegashima, Japan. 

Image Credit: NASA/Bill Ingalls

The Global Precipitation Measurement (GPM) Core Observatory, a joint Earth-observing mission between NASA and the Japan Aerospace Exploration Agency (JAXA), thundered into space at 10:37 a.m. PST Thursday, Feb. 27 (3:37 a.m. JST Friday, Feb. 28) from Japan.

The four-ton spacecraft launched aboard a Japanese H-IIA rocket from Tanegashima Space Center on Tanegashima Island in southern Japan.

The GPM spacecraft separated from the rocket 16 minutes after launch, at an altitude of 247 miles (398 kilometers). The solar arrays deployed 10 minutes after spacecraft separation, to power the spacecraft.

"With this launch, we have taken another giant leap in providing the world with an unprecedented picture of our planet's rain and snow," said NASA Administrator Charles Bolden.

"GPM will help us better understand our ever-changing climate, improve forecasts of extreme weather events like floods, and assist decision makers around the world to better manage water resources."

The GPM Core Observatory will take a major step in improving upon the capabilities of the Tropical Rainfall Measurement Mission (TRMM), a joint NASA-JAXA mission launched in 1997 and still in operation.

While TRMM measured precipitation in the tropics, the GPM Core Observatory expands the coverage area from the Arctic Circle to the Antarctic Circle. GPM will also be able to detect light rain and snowfall, a major source of available fresh water in some regions.


To better understand Earth's weather and climate cycles, the GPM Core Observatory will collect information that unifies and improves data from an international constellation of existing and future satellites by mapping global precipitation every three hours.

"It is incredibly exciting to see this spacecraft launch," said GPM Project Manager Art Azarbarzin of NASA's Goddard Space Flight Center in Greenbelt, Md. "This is the moment that the GPM team has been working toward since 2006.

"The GPM Core Observatory is the product of a dedicated team at Goddard, JAXA and others worldwide."

"Soon, as GPM begins to collect precipitation observations, we'll see these instruments at work providing real-time information for the scientists about the intensification of storms, rainfall in remote areas and so much more."

Wednesday, January 29, 2014

NASA MABEL: Laser Lidar technology reveals how ice measures up

NASA's Multiple Altimeter Beam Experimental Lidar flew over Southwest Greenland's glaciers and sea ice to test a new method of measuring the height of Earth from space. 

Credit: NASA/Tim Williams

New results from NASA's MABEL campaign demonstrated that a photon-counting technique will allow researchers to track the melt or growth of Earth's frozen regions.

When a high-altitude aircraft flew over the icy Arctic Ocean and the snow-covered terrain of Greenland in April 2012, it was the first polar test of a new laser-based technology to measure the height of Earth from space.

Aboard that aircraft flew the Multiple Altimeter Beam Experimental Lidar (MABEL), which is an airborne test bed instrument for NASA's ICESat-2 satellite mission slated to launch in 2017.

Both MABEL and ICESat-2's ATLAS instrument are photon counters – they send out pulses of green laser light and time how long it takes individual light photons to bounce off Earth's surface and return.

ICESat-2's ATLAS instrument
That time, along with ATLAS' exact position from an onboard GPS, will be plugged into computer programs to tell researchers the elevation of Earth's surface – measuring change to as little as the width of a pencil.

This kind of photon-counting technology is novel for satellites; from 2003 to 2009, ICESat-1's instrument looked at the intensity of a returned laser signal, which included many photons.

So getting individual photon data from MABEL helps scientists prepare for the vast amounts of elevation data they'll get from ICESat-2.

"Using the individual photons to measure surface elevation is a really new thing," said Ron Kwok, a senior research scientist at NASA's Jet Propulsion Laboratory in Pasadena, Calif.

"It's never been done from orbiting satellites, and it hasn't really been done much with airborne instruments, either."

Ron Kwok
ICESat-2 is tasked with measuring elevation across Earth's entire surface, including vegetation and oceans, but with a focus on change in the frozen areas of the planet, where scientists have observed dramatic impacts from climate change.

There, two types of ice – ice sheets and sea ice – reflect light photons in different patterns.

Ice sheets and glaciers are found on land, like Greenland and Antarctica, and are formed as frozen snow and rain accumulates.

Sea ice, on the other hand, is frozen seawater, found floating in the Arctic Ocean and offshore of Antarctica.

MABEL's 2012 Greenland campaign was designed to observe a range of interesting icy features, said Bill Cooke, MABEL's lead scientist at NASA's Goddard Space Flight Center in Greenbelt, Md.

With the photon counts from different surfaces, other scientists could start analyzing the data to determine which methods of analyzing the data allow them to best measure the elevation of Earth's surface.

MABEL, short for "Multiple Altimeter Beam Experimental Lidar," serves as an ICESat-2 simulator. 

Credit: NASA /Kelly Brunt

"We wanted to get a wide variety of target types, so that the science team would have a lot of data to develop algorithms," Cooke said.

"This was our first real dedicated science mission."

The flights over the ocean near Greenland, for example, allowed researchers to demonstrate that they can measure the height difference between open water and sea ice, which is key to determining the ice thickness.

MABEL can detect enough of the laser light photons that bounce off Earth surface and return to the instrument, and programs can then make necessary elevation calculations, Cooke said.

Bill Cooke
"Part of what we're doing with MABEL is to demonstrate ICESat-2's instrument is going to have the right sensitivity to do the measurements," Cooke said. "You can do this photon counting if you have enough photons."

In an article recently published in the Journal of Atmospheric and Oceanic Technology, Kwok and his colleagues showed how to calculate elevation from MABEL data, and do so over different types of ice – from open water, to thin, glassy ice, to the snow-covered ice.

Thursday, January 9, 2014

Baryon Oscillation Spectroscopic Survey measures the universe to one-percent accuracy

This is an artist's concept of the new measurement of the size of the Universe. 

The gray spheres show the pattern of the "baryon acoustic oscillations (BAO)" from the early Universe. 

Galaxies today have a slight tendency to align on the spheres -- the alignment is greatly exaggerated in this illustration. 

By comparing the size of the spheres (white line) to the predicted value, astronomers can determine to one-percent accuracy how far away the galaxies are. 

Credit: Zosia Rostomian, Lawrence Berkeley National Laboratory

Today the Baryon Oscillation Spectroscopic Survey (BOSS) Collaboration announced that BOSS has measured the scale of the universe to an accuracy of one percent.

This and future measures at this precision are the key to determining the nature of dark energy.

David Schlegel
"One-percent accuracy in the scale of the universe is the most precise such measurement ever made," says BOSS's principal investigator, David Schlegel, a member of the Physics Division of the U.S. Department of Energy's Lawrence Berkeley National Laboratory (Berkeley Lab).

"Twenty years ago astronomers were arguing about estimates that differed by up to fifty percent. Five years ago, we'd refined that uncertainty to five percent; a year ago it was two percent. One-percent accuracy will be the standard for a long time to come."

BOSS is the largest program in the third Sloan Digital Sky Survey (SDSS-III). Since 2009, BOSS has used the Sloan Foundation Telescope at the Apache Point Observatory in New Mexico to record high-precision spectra of well over a million galaxies with redshifts from 0.2 to 0.7, looking back over six billion years into the universe's past.

Schlegel says, "We believe the BOSS database includes more redshifts of galaxies than collected by all the other telescopes in the world."

Martin White
BOSS will continue gathering data until June, 2014. However, says Martin White, a member of Berkeley Lab, a professor of physics and astronomy at the University of California at Berkeley, and chair of the BOSS science survey team, "We've done the analysis now because we have 90 percent of BOSS's final data and we're tremendously excited by the results."

Baryon acoustic oscillations (BAO) are the regular clustering of galaxies, whose scale provides a "standard ruler" to measure the evolution of the universe's structure.

Accurate measurement dramatically sharpens our knowledge of fundamental cosmological properties, including how dark energy accelerates the expansion of the universe.

More Information: The BOSS analysis is based on SDSS-III's Data Releases 10 and 11 (DR 10 and DR 11) and has been submitted for publication in the Monthly Notices of the Royal Astronomical Society; the analysis is available online at arxiv.org/abs/1312.4877.

Sunday, October 14, 2012

NASA Spitzer: Scientists refine measurement of Universe's expansion rate

The Spitzer Space Telescope has measured the universe's expansion rate with one of the most precise instruments yet, according to NASA.

The edge of space is blasting outwards at the rate of around 74.3 kilometres per second per megaparsec; a megaparsec is about three million light-years in length.

NASA initially announced the results October 3, but clarified it a few days later to include mention of an independent study from the United States' Space Telescope Science Institute (STSCI) in Baltimore, Maryland.

"Spitzer is yet again doing science beyond what it was designed to do," stated JPL project scientist Michael Werner in a recent press release.

"First, Spitzer surprised us with its pioneering ability to study exoplanet atmospheres, and now, in the mission's later years, it has become a valuable cosmology tool."

Spitzer Space Telescope
The Spitzer Space Telescope (SST), formerly the Space Infrared Telescope Facility (SIRTF) is an infrared space observatory launched in 2003. It is the fourth and final of the NASA Great Observatories program.

The Hubble Constant
The universe's expansion rate is known as the Hubble Constant, and it has been revised several times over the years as the technology to measure it has improved.

Measuring Cepheids
Astronomers used the Spitzer telescope to observe Cepheids, which are stars that pulse at a regular rate.

Since observed Cepheids pulse at a rate that is relative to their brightness, these provide a useful measuring stick for astronomers seeking to measure the expanse of the universe.

Standard Candles
Cepheids are also known as "standard candles" because the principle to measuring the universe with them is similar to a person trying to measure his surroundings by observing candles.

Spitzer watched 10 Cepheids in the Milky Way and another 80 in the Large Magellanic Cloud, a galaxy that is relatively close to Earth.

Because Spitzer can peer through cosmic dust that obscures starlight, the measurements of brightness it came up with were more precise than previous observations.

This measurement led to the calculation of a more precise Hubble Constant.