Showing posts with label Milky Way. Show all posts

Saturday, December 20, 2014

ESA's Planck Satellite: The magnetic field along the galactic plane

Credit: ESA/Planck Collaboration. 

Acknowledgment: M.-A. Miville-Deschênes, CNRS – Institut d’Astrophysique Spatiale, Université Paris-XI, Orsay, France

While the pastel tones and fine texture of this image may bring to mind brush strokes on an artist's canvas, they are in fact a visualisation of data from ESA's Planck satellite.

The image portrays the interaction between interstellar dust in the Milky Way and the structure of our Galaxy's magnetic field.

Between 2009 and 2013, Planck scanned the sky to detect the most ancient light in the history of the Universe, the cosmic microwave background.

It also detected significant foreground emission from diffuse material in our Galaxy which, although a nuisance for cosmological studies, is extremely important for studying the birth of stars and other phenomena in the Milky Way.

Among the foreground sources at the wavelengths probed by Planck is cosmic dust, a minor but crucial component of the interstellar medium that pervades the Galaxy. Mainly gas, it is the raw material for stars to form.

Interstellar clouds of gas and dust are also threaded by the Galaxy's magnetic field, and dust grains tend to align their longest axis at right angles to the direction of the field.

As a result, the light emitted by dust grains is partly 'polarised', it vibrates in a preferred direction, and, as such, could be caught by the polarisation-sensitive detectors on Planck.

Scientists in the Planck collaboration are using the polarised emission of interstellar dust to reconstruct the Galaxy's magnetic field and study its role in the build-up of structure in the Milky Way, leading to star formation.

In this image, the colour scale represents the total intensity of dust emission, revealing the structure of interstellar clouds in the Milky Way.

The texture is based on measurements of the direction of the polarised light emitted by the dust, which in turn indicates the orientation of the magnetic field.

This image shows the intricate link between the magnetic field and the structure of the interstellar medium along the plane of the Milky Way.

In particular, the arrangement of the magnetic field is more ordered along the Galactic plane, where it follows the spiral structure of the Milky Way. Small clouds are seen just above and below the plane, where the magnetic field structure becomes less regular.

From these and other similar observations, Planck scientists found that filamentary interstellar clouds are preferentially aligned with the direction of the ambient magnetic field, highlighting the strong role played by magnetism in galaxy evolution.

The emission from dust is computed from a combination of Planck observations at 353, 545 and 857 GHz, whereas the direction of the magnetic field is based on Planck polarisation data at 353 GHz.

Sunday, November 23, 2014

MOPRA: A real interstellar explorer but its days are numbered

The MOPRA telescope will find itself out of commission in a year. 

Credit: Balt Indermuehle

Australia's MOPRA telescope, nestled in NSW's Warrumbungle National Park, is earmarked for closure in a year thanks to CSIRO funding cuts, but this one-of-a-kind telescope is well worth saving.

Few of us get the opportunity to explore space, yet the "last frontier" retains an aura of mystery that fascinates us.

The film Interstellar not only is a Hollywood blockbuster, but also provides realistic simulations of what interstellar space might look like, at least if one has the misfortune to find oneself near a black hole. So what really is out there and how do we see it?

While the astronomer's telescopes may not allow us to journey to space, they do let us peer out into the cosmos, to a realm dominated by stars and galaxies.

Mopra, located at the foot of Siding Spring Observatory, has a unique view of a section of our galaxy hidden from northern hemisphere sight. This remote outpost has been mapping the centre of the Milky Way for four years, but funding cuts only give it one more year to complete this massive task.

Interstellar exploration (from Earth)

The southern galactic plane passes directly over Australia each night and contains the richest part of our galaxy, with its dynamic centre and the majority of the active star-forming clouds in its spiral arms.

The 22m diameter Mopra radio telescope, with the author alongside. 

Credit: Cormac Purcell, CC BY-SA

The Mopra telescope has been engaged for the past four years in its cartographic survey of the fourth quadrant of our Milky Way galaxy.

This is the sector that cannot be seen from northern skies, but contains the most dynamic parts, its centre and the most active star forming clouds.

It's what we call its delta quadrant; the least explored region of the galaxy.

Mopra's survey is now two-thirds completed. Some 60 degrees of sky have been mapped along the heart of the galactic plane, and the telescope is working near perfectly.

Mopra is a radio telescope which measures interstellar gas between stars. This gas makes up 99% of the interstellar medium and provides the raw material for galactic evolution, driving the birth and death of stars.

These interstellar molecular clouds are the coldest environments in space, and may harbour the raw ingredients for life in the form of simple organic molecules.

In the Milky Way, clouds of this gas are spread over several light-years and can be a million times heavier than our sun.

With a dish 22m in diameter, the view of these gas clouds from Mopra is more than ten times sharper than the best such map astronomers currently have of the southern galactic plane.

Over the past decade, astronomers have been building up an exquisitely detailed picture of where the dust in interstellar space lies using a variety of infrared space-based telescopes.

A 10-degree portion from the new map of the galactic plane, showing molecular gas (in red) overlaid on atomic gas (in blue). 

Credit: Catherine Braiding

We know from them where the stars and gas are largely found, but we know little about the detailed distribution of gas and of the activity its clouds are engaged in.

The spectral fingerprints of the gas must be measured at longer wavelengths which requires much larger telescopes, such as Mopra.


Thursday, November 6, 2014

ESA's GAIA satellite set to discover thousands of planets in Milky Way

Princeton University and Lund University researchers project that the recently launched ESA's Gaia satellite could discover tens of thousands of planets during its five-year mission. 

In this image, the colored portions indicate the number of observations Gaia would make of a particular part of the sky during its mission; the scale at the bottom indicates the number of observations from zero (purple) to 200 (red). 

The total number of observations of any part of the sky ranges from about 60 at low ecliptic latitudes to about 80 at high ecliptic latitudes, with a maximum of about 150-200 at intermediate latitudes. 

From these many different observations of each star, the highly accurate Gaia measurements will reveal the tiny star motion, or "wobble," that results from any orbiting planet. 

Credit: Lennart Lindegren, Lund University

A recently launched European satellite could reveal tens of thousands of new planets within the next few years, and provide scientists with a far better understanding of the number, variety and distribution of planets in our galaxy, according to research published today.

Researchers from Princeton University and Lund University in Sweden calculated that ESA's observational satellite Gaia could detect as many as 21,000 exoplanets, or planets outside of Earth's solar system, during its five-year mission.

If extended to 10 years, Gaia could detect as many as 70,000 exoplanets, the researchers report.

The researchers' assessment is accepted in the Astrophysical Journal and was published Nov. 6 in advance-of-print on arXiv, a preprint database run by Cornell University.

Exoplanets will be an important "by-product" of Gaia's mission, Perryman said. Built and operated by the European Space Agency (ESA) and launched in December 2013, Gaia will capture the motion, physical characteristics and distance from Earth, and one another, of roughly 1 billion objects, mostly stars, in the Milky Way galaxy with unprecedented precision.

The presence of an exoplanet will be determined by how its star "wobbles" as a result of the planet's orbit around it.

More important than the numbers of predicted discoveries are the kinds of planets that the researchers expect Gaia to detect, many of which, such as planets with multi-year orbits that pass directly, or transit, in front of their star as seen from Earth, are currently difficult to find, explained first author Michael Perryman, an adviser on large scientific programs who made the assessment while serving as Princeton's Bohdan Paczyński Visiting Fellow in the Department of Astrophysical Sciences, Dublin.

The satellite's instruments could reveal objects that are considered rare in the Milky Way, such as an estimated 25 to 50 Jupiter-sized planets that orbit faint, low-mass stars known as red dwarfs.

One of the main objectives of the Gaia mission is to establish the currently uncertain distance from Earth to various stars using high-precision triangulation, which would allow a much better understanding of the properties of the stars and the planets orbiting them. 

Of the 1,163 confirmed transiting planets, which pass directly in front of their stars as seen from Earth, there are 644 distinct host stars; less than 200 have accurately known distances from Earth. 

This image shows the distances from Earth (center) to the stars (black dots) of transiting exoplanets. 

The inner dashed circle has a radius of 100 parsecs (about 326 light years) with the middle and outer circles corresponding to 500 parsecs (1,630 light years) and 1,000 parsecs (3,260 light years), respectively. 

The cluster of points to the lower right represents the transiting planets discovered by NASA's Kepler satellite. For each star, the straight lines extending from the circle indicate the current uncertainty of its distance from Earth. 

Credit: Michael Perryman

Unique planets and systems, such as planets that orbit in the opposite direction of their companions, can inspire years of research, Perryman said.

"It's not just about the numbers. Each of these planets will be conveying some very specific details, and many will be highly interesting in their own way," Perryman said.

"If you look at the planets that have been discovered until now, they occupy very specific regions of discovery space. Gaia will not only discover a whole list of planets, but in an area that has not been thoroughly explored so far."

More information: Michael Perryman, Joel Hartman, Gáspár Bakos and Lennart Lindegren. 2014. "Astrometric exoplanet detection with Gaia." Astrophysical Journal. Arti¬cle first pub-lished to the Cornell University arXiv preprint database: Nov. 6, 2014.

Wednesday, October 29, 2014

LOFAR discovers largest carbon atoms outside our Milky Way

The starburst galaxy M82, the size of the carbon atoms and the observed spectral line. 

Credit: NASA, ESA, and The Hubble Heritage Team (STScI/AURA)

An international team of astronomers under the guidance of graduate student Leah Morabito of Leiden Observatory has for the first time discovered the largest carbon atoms outside our Milky Way with the LOFAR radio telescope.

In the future astronomers will be able to measure how cold and dense the gas around these atoms is that influences star formation and the evolution of a galaxy. The results are published in the journal Astrophysical Journal Letters on October 28th.

"Carbon atoms are about half a million times smaller than the average thickness of a human hair, but they can be a billion times larger in the cold and sparse gas. The outermost electron is then orbiting the nucleus at a much larger distance," explains first author Morabito.

The outermost electron can be captured by an atom that is missing an electron. A spectral line will then be visible in the light spectrum. All spectral lines form the chemical fingerprint of an atom such as carbon.

Astronomers predicted in the 70's that the carbon spectral line would be detectable outside our galaxy. This first observation took 40 years to be made.

The line is hard to detect because it is too faint when the gas that is surrounding the atoms is too warm or too dense.

The cold, sparse gas is present in starburst galaxies, galaxies in which stars form at a high rate. For this reason the carbon spectral line is easier to detect in galaxies of this type.

Most radio telescopes observe at frequencies at which the carbon line can not be detected. Other telescopes are not sensitive enough to detect the spectral lines of the carbon atoms at low frequencies.

The LOFAR radio telescope, that stretches from the northeast of the Netherlands across Europe, is perfect for these kind of observations because of its frequency range and sensitivity.

Co-author Raymond Oonk from Leiden Observatory en ASTRON: "LOFAR is an unique telescope. This telescope opens up a new window on the universe."

The carbon atoms are present in the heart of the starburst galaxy M82, where 10 times more stars are being born in the same period as in our Milky Way.

The cold and sparse gas in this area impacts star formation, and the evolution of M82. "Since the co-discovery of the hydrogen 21-cm line by Dutch, American and Australian astronomers, we have been looking for a way to determine additional properties of the cold gas such as its temperature and density. It is fantastic that we now have found a way thanks to this carbon line.

We can now collect more and better observations, and compare them to predictions from theoretical models," says co-author Huub Röttgering (Leiden Observatory).

More information: "Discovery of Carbon Radio Recombination Lines in M82," Leah K. Morabito et al., Astrophysical Journal Letters, 28 October 2014 DOI: 10.1088/2041-8205/795/2/L33 . http://arxiv.org/abs/1410.1544

Monday, September 29, 2014

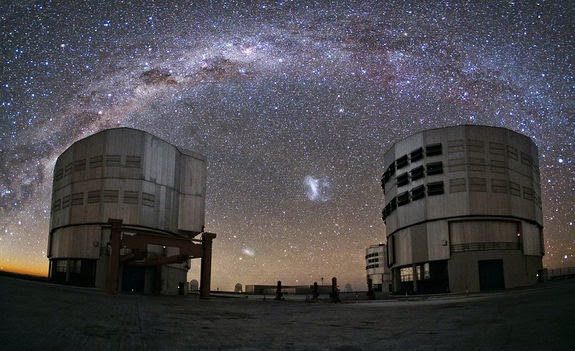
The Milky Way glitters over ESO Paranal Observatory

The Milky Way glitters over Paranal Observatory atop Cerro Paranal in Chile's high Atacama Desert in this amazing image by ESO photo ambassador Yuri Beletsky

Here, two unit telescopes with Paranal's Very Large Telescope (VLT) take center stage.

Between the two telescopes are the Large Magellanic Cloud and Small Magellenic Cloud, dwarf galaxies near our own Milky Way.

Meanwhile, the Coalsack Nebula can be spotted as a dark mark obscuring part of the Milky Way at upper left.

To see more amazing photos from the observatory, visit: Spectacular Cosmic Visions from ESO's Paranal Observatory 

Friday, September 19, 2014

ISS crew capture Milky Way from orbit

Image Credit: NASA

One of the Expedition 41 crew members aboard the Earth-orbiting International Space Station on Sept. 13, 2014 captured this image of a starry sky.

The white panel at left belonging to ESA's ATV-5 spacecraft, which is docked with the orbital outpost, obstructs the view of Scorpius.

The red star Antares is directly to the left of the bottom of the second ATV panel from the top.

The two stars that are close together and on the lower left of the photo comprise Shaula, the tip of the scorpion’s tail.

The open cluster close to Shaula is M7. The hardware at bottom right is part of one of the station's solar panels.

M7: Open Star Cluster in Scorpius


Tuesday, September 16, 2014

IPHAS: Most detailed catalogue of the visible Milky Way released

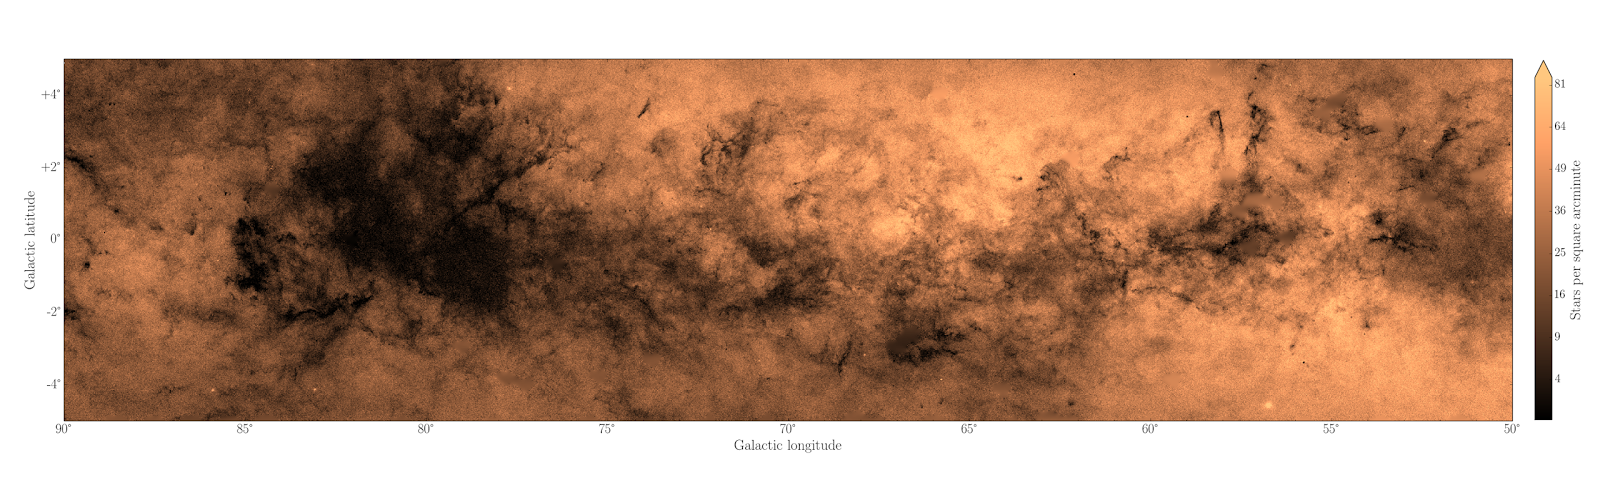
Click on the image to see the large version.

A density map of part of the Milky Way disk, constructed from IPHAS data. The scales show galactic latitude and longitude, coordinates that relate to the position of the centre of the galaxy. 

The mapped data are the counts of stars detected in i, the longer (redder) wavelength broad band of the survey, down to a faint limit of 19th magnitude. 

Although this is just a small section of the full map, it portrays in exquisite detail the complex patterns of obscuration due to interstellar dust. 

This image contains 600 x 2400 independent data points, each of which represents the star count within 1 x 1 square arcminute cells (1 arcminute is 1/60th of a degree). 

At the level of the original exposed images, each cell is itself made up of 32000 pixels. 

The typical effective angular resolution of the data is close to 1 arcsecond (1/3600th of a degree or about 10 original image pixels). 

The section shown features the edge of the Sagittarius spiral arm (near longitude 60 degrees) and the Cygnus-X

A new catalogue of the visible part of the northern part of our home Galaxy, the Milky Way, includes no fewer than 219 million stars.

Geert Barentsen of the University of Hertfordshire led a team who assembled the catalogue in a ten year programme using the Isaac Newton Telescope (INT) on La Palma in the Canary Islands.

Their work appears today in the journal Monthly Notices of the Royal Astronomical Society. A preprint version is available on the arXiv server.

From dark sky sites on Earth, the Milky Way appears as a glowing band stretching across the sky.

To astronomers, it is the disk of our own galaxy, a system stretching across 100,000 light-years, seen edge-on from our vantage point orbiting the Sun.

The disk contains the majority of the stars in the galaxy, including the Sun, and the densest concentrations of dust and gas.

Isaac Newton Telescope (INT)
The unaided human eye struggles to distinguish individual objects in this crowded region of the sky, but the 2.5-m mirror of the INT enabled the scientists to resolve and chart 219 million separate stars.

The INT programme charted all the stars brighter than 20th magnitude,or 1 million times fainter than can be seen with the human eye.

Using the catalogue, the scientists have put together an extraordinarily detailed map of the disk of the Galaxy that shows how the density of stars varies, giving them a new and vivid insight into the structure of this vast system of stars, gas and dust.

The image included here, a cut-out from a stellar density map mined directly from the released catalogue, illustrates the new view obtained.

The Turner-like brush strokes of dust shadows would grace the wall of any art gallery. Maps like these also stand as useful tests of new-generation models for the Milky Way.

The production of the catalogue, IPHAS DR2 (the second release from the survey programme The INT Photometric H-alpha Survey of the Northern Galactic Plane or IPHAS), is an example of modern astronomy's exploitation of 'big data', it contains information on the 219 million detected objects, each of which is summarised in 99 attributes.

With this catalogue release, the team are offering the world community free access to measurements taken through two broad band filters capturing light at the red end of the visible spectrum, and in a narrowband capturing the brightest hydrogen emission line, H-alpha.

The inclusion of H-alpha also enables exquisite imaging of the nebulae (glowing clouds of gas) found in greatest number within the disk of the Milky Way.

The stellar density map illustrated here is derived from the longest (reddest) wavelength band in which the darkening effect of the dust is moderated in a way that brings out more of its structural detail, compared to maps built at shorter (bluer) wavelengths.

More information
"The second data release of the INT Photometric Hα Survey of the Northern Galactic Plane (IPHAS DR2)", Barentsen et al, Monthly Notices of the Royal Astronomical Society, vol. 444, pp. 3230-3257, 2014, published by Oxford University Press. A preprint version is available on the arXiv server.

Wednesday, September 10, 2014

Outside the Milky Way: Globular cluster Messier 54

This new image from the ESO VLT Survey Telescope in northern Chile shows a vast collection of stars, the globular cluster Messier 54. 

This cluster looks similar to many others but it has a secret.

Messier 54 doesn't belong to the Milky Way, but is part of a satellite galaxy, the Sagittarius Dwarf Galaxy.

This parentage allowed astronomers to test whether there are also low levels of the element lithium in stars outside the Milky Way.

The Milky Way galaxy is orbited by more than 150 globular star clusters, which are balls of hundreds of thousands of old stars dating back to the formation of the galaxy.

One of these, along with several others in the constellation of Sagittarius (The Archer), was found in the late eighteenth century by the French comet hunter Charles Messier and given the designation Messier 54.

For more than two hundred years after its discovery Messier 54 was thought to be similar to the other Milky Way globulars, but in 1994 it was discovered that it was actually associated with a separate galaxy, the Sagittarius Dwarf Galaxy.

It was found to be at a distance of around 90 000 light-years, more than three times as far from Earth as the galactic centre.

Astronomers have now observed Messier 54 using the VLT as a test case to try to solve one of the mysteries of modern astronomy, the lithium problem.

Most of the light chemical element lithium now present in the Universe was produced during the Big Bang, along with hydrogen and helium, but in much smaller quantities.

Astronomers can calculate quite accurately how much lithium they expect to find in the early Universe, and from this work out how much they should see in old stars, but the numbers don't match, there is about three times less lithium in stars than expected.

This mystery remains, despite several decades of work.

Up to now it has only been possible to measure lithium in stars in the Milky Way, but now a team of astronomers led by Alessio Mucciarelli (University of Bologna, Italy) has used the VLT to measure how much lithium there is in a selection of stars in Messier 54.

They find that the levels are close to those in the Milky Way. So, whatever it is that got rid of the lithium seems not to be specific to the Milky Way.

This new image of the cluster was created from data taken with the ESO VLT Survey Telescope (VST) at the Paranal Observatory.

As well as showing the cluster itself it reveals the extraordinarily dense forest of much closer Milky Way stars that lie in the foreground.

More information: This research was presented in a paper, "The cosmological Lithium problem outside the Galaxy: the Sagittarius globular cluster M54", by A. Mucciarelli et al., to appear in Monthly Notices of the Royal Astronomical Society (Oxford University Press). (PDF)

Tuesday, September 9, 2014

Milky Way's missing satellite galaxies: Interactive dark matter

The simulated distribution of DM in a Milky Way-like galaxies for standard, non-interacting dark matter (top left), warm dark matter (top right) and the new dark matter model that interacts with the photon background (bottom) are shown. 

Smaller structures are erased up to the point where, in the most extreme model (bottom right), the galaxy is completely sterilized. 

Credit: Credit: Durham University

Scientists believe they have found a way to explain why there are not as many galaxies orbiting the Milky Way as expected.

Computer simulations of the formation of our galaxy suggest that there should be many more, smaller galaxies around the Milky Way than are observed through telescopes.

This has thrown doubt on the generally accepted theory of cold dark matter, a substance that scientists predict should allow for more galaxy formation around the Milky Way than is seen.

Now cosmologists and particle physicists at the Institute for Computational Cosmology (ICC) and the Institute for Particle Physics Phenomenology (IPPP), at Durham University, working with colleagues at LAPTh College & University in France, think they have found a potential solution to the problem.

Writing in the journal Monthly Notices of the Royal Astronomical Society (MNRAS), the scientists suggest that dark matter particles, as well as feeling the force of gravity, could have interacted with photons and neutrinos in the young Universe, causing the dark matter to scatter.

Scientists think clumps of dark matter, or halos, that emerged from the early Universe, trapped the intergalactic gas needed to form stars and galaxies.

Scattering the dark matter particles wipes out the structures that can trap gas, stopping more galaxies from forming around the Milky Way and reducing the number that should exist.

Two models of the dark matter distribution in the halo of a galaxy like the Milky Way, separated by the white line are shown. 

The colours represent the density of dark matter, with red indicating high-density and blue indicating low-density. 

On the left is a simulation of how non-interacting cold dark matter produces an abundance of smaller satellite galaxies. 

On the right the simulation shows the situation when the interaction of dark matter with other particles reduces the number of satellite galaxies we expect to observe around the Milky Way. 

Credit: Durham University

Lead author Dr Celine Boehm, in the Institute for Particle Physics Phenomenology, at, Durham University, said: "We don't know how strong these interactions should be, so this is where our simulations come in.

"By tuning the strength of the scattering of particles, we change the number of small galaxies, which lets us learn more about the physics of dark matter and how it might interact with other particles in the Universe.

"This is an example of how a cosmological measurement, in this case the number of galaxies orbiting the Milky Way, is affected by the microscopic scales of particle physics."

There are several theories about why there are not more galaxies orbiting the Milky Way, which include the idea that heat from the Universe's first stars sterilised the gas needed to form stars.

The researchers say their current findings offer an alternative theory and could provide a novel technique to probe interactions between other particles and cold dark matter.

Co-author Professor Carlton Baugh, in the Institute for Computational Cosmology, at Durham University, said: "Astronomers have long since reached the conclusion that most of the matter in the Universe consists of elementary particles known as dark matter.

"This model can explain how most of the Universe looks, except in our own backyard where it fails miserably.

"The model predicts that there should be many more small satellite galaxies around our Milky Way than we can observe.

"However, by using computer simulations to allow the dark matter to become a little more interactive with the rest of the material in the Universe, such as photons, we can give our cosmic neighbourhood a makeover and we see a remarkable reduction in the number of galaxies around us than originally thought."

The calculations were carried out using the COSMA supercomputer at Durham University, which is part of the UK-wide DiRAC super-computing framework.

More information: Monthly Notices of the Royal Astronomical Society , mnrasl.oxfordjournals.org/look… 0.1093/mnrasl/slu115

Wednesday, September 3, 2014

Laniakea supercluster: Newly identified galactic supercluster, home to the Milky Way

A slice of the Laniakea Supercluster in the supergalactic equatorial plane, an imaginary plane containing many of the most massive clusters in this structure. 

The colours represent density within this slice, with red for high densities and blue for voids, areas with relatively little matter. 

Individual galaxies are shown as white dots. 

Velocity flow streams within the region gravitationally dominated by Laniakea are shown in white, while dark blue flow lines are away from the Laniakea local basin of attraction. 

The orange contour encloses the outer limits of these streams, a diameter of about 160 Mpc. This region contains the mass of about 100 million billion suns. 

Credit: SDvision interactive visualization software by DP at CEA/Saclay, France.

Astronomers using the National Science Foundation's Green Bank Telescope (GBT), among other telescopes, have determined that our own Milky Way galaxy is part of a newly identified ginormous supercluster of galaxies, which they have dubbed "Laniakea," which means "immense heaven" in Hawaiian.

This discovery clarifies the boundaries of our galactic neighbourhood and establishes previously unrecognized linkages among various galaxy clusters in the local Universe.

"We have finally established the contours that define the supercluster of galaxies we can call home," said lead researcher R. Brent Tully, an astronomer at the University of Hawaii at Manoa.

"This is not unlike finding out for the first time that your hometown is actually part of much larger country that borders other nations."

The paper explaining this work is the cover story of the September 4 issue of the journal Nature.

Superclusters are among the largest structures in the known Universe. They are made up of groups, like our own Local Group, that contain dozens of galaxies, and massive clusters that contain hundreds of galaxies, all interconnected in a web of filaments.

Though these structures are interconnected, they have poorly defined boundaries.

To better refine cosmic mapmaking, the researchers are proposing a new way to evaluate these large-scale galaxy structures by examining their impact on the motions of galaxies.

A galaxy between structures will be caught in a gravitational tug-of-war in which the balance of the gravitational forces from the surrounding large-scale structures determines the galaxy's motion.

By using the GBT and other radio telescopes to map the velocities of galaxies throughout our local Universe, the team was able to define the region of space where each supercluster dominates.

"Green Bank Telescope observations have played a significant role in the research leading to this new understanding of the limits and relationships among a number of superclusters," said Tully.


The Milky Way resides in the outskirts of one such supercluster, whose extent has for the first time been carefully mapped using these new techniques.

This so-called Laniakea Supercluster is 500 million light-years in diameter and contains the mass of one hundred million billion Suns spread across 100,000 galaxies.

This study also clarifies the role of the Great Attractor, a gravitational focal point in intergalactic space that influences the motion of our Local Group of galaxies and other galaxy clusters.

Two views of the Laniakea Supercluster. 

Credit: SDvision interactive visualization software by DP at CEA/Saclay, France

Within the boundaries of the Laniakea Supercluster, galaxy motions are directed inward, in the same way that water streams follow descending paths toward a valley.

The Great Attractor region is a large flat bottom gravitational valley with a sphere of attraction that extends across the Laniakea Supercluster.

The name Laniakea was suggested by Nawa'a Napoleon, an associate professor of Hawaiian Language and chair of the Department of Languages, Linguistics, and Literature at Kapiolani Community College, a part of the University of Hawaii system. The name honors Polynesian navigators who used knowledge of the heavens to voyage across the immensity of the Pacific Ocean.

More information: Nature, dx.doi.org/10.1038/nature13674

Tuesday, August 19, 2014

Exoplanet measured with remarkable precision

Barely 30 years ago, the only planets astronomers had found were located right here in our own solar system.

The Milky Way is chock-full of stars, millions of them similar to our own sun. Yet the tally of known worlds in other star systems was exactly zero.

What a difference a few decades can make.

As 2014 unfolds, astronomers have not only found more than a thousand "exoplanets" circling distant suns, but also they're beginning to make precise measurements of them.

The old void of ignorance about exoplanets is now being filled with data precise to the second decimal place.

A team led by Sarah Ballard, a NASA Carl Sagan Fellow at the University of Washington in Seattle, recently measured the diameter of a "super Earth" to within an accuracy of 148 miles total or about 1 percent, remarkable accuracy for an exoplanet located about 300 light years from Earth.

"It does indeed seem amazing," says Ballard. "The landscape of exoplanet research has changed to an almost unrecognizable degree since I started graduate school in 2007."

To size up the planet, named "Kepler 93 b," Ballard used data from NASA's Kepler and Spitzer Space Telescopes.

First, Kepler discovered the planet. As seen from Earth, Kepler 93 b passes directly in front of its parent star, causing the starlight to dim during the transit.

That dimming, which occurs once per orbit, is what allowed Kepler mission scientists to find the planet in the first place.

Kepler Space Telescope
Next, both Spitzer and Kepler Space Telescope recorded multiple transits at visible and infrared wavelengths.

Data from the observatories agreed: Kepler 93 b was really a planet and not some artefact of stellar variability.

Ballard then knew that by looking carefully at the light curve she could calculate the size of the planet relative to the star.

At that point, the only missing piece was the diameter of the star itself.

"The precision with which we measured the size of the planet is linked directly to our measurement of the star," says Ballard. "And we measured the star using a technique called astero-seismology."

Most people have heard of "seismology," the study of seismic waves moving through the Earth. "We can learn a lot about the structure of our planet by studying seismic waves," she says.

Asteroseismology is the same thing, except for stars: The outer layers of stars boil like water on top of a hot stove. Those convective motions create seismic waves that bounce around inside the core, causing the star to ring like an enormous bell. Kepler can detect that "ringing," which reveals itself as fluctuations in a star's brightness.

Ballard's colleague, University of Birmingham professor Bill Chaplin led the asteroseismic analysis for Kepler-93 b.

"By analyzing the seismic modes of the star, he was able to deduce its radius and mass to an accuracy of a percent," she says.

The new measurements confirm that Kepler-93 b is a "super-Earth" sized exoplanet, with a diameter about one-and-a-half times the size of our planet.

Previous measurements by the Keck Observatory in Hawaii had put Kepler-93 b's mass at about 3.8 times that of Earth.

The density of Kepler-93 b, derived from its mass and newly obtained radius, suggests the planet is very likely made of iron and rock, like Earth itself.

Although super-Earths are common in the galaxy, none exist in our solar system. That makes them tricky to study.

Ballard's team has shown, however, that it is possible to learn a lot about an exoplanet even when it is very far away.

Friday, August 1, 2014

Fermi bubbles defy explanation, Despite extensive analysis

This artist's representation shows the Fermi bubbles towering above and below the galaxy. 

Credit: NASA's Goddard Space Flight Center

Scientists from Stanford University and the Department of Energy's SLAC National Accelerator Laboratory have analyzed more than four years of data from NASA's Fermi Gamma-ray Space Telescope, along with data from other experiments, to create the most detailed portrait yet of two towering bubbles that stretch tens of thousands of light-years above and below our galaxy.

The bubbles, which shine most brightly in energetic gamma rays, were discovered almost four years ago by a team of Harvard astrophysicists led by Douglas Finkbeiner who combed through data from Fermi's main instrument, the Large Area Telescope (FGST).

The new portrait, described in a paper that has been accepted for publication in The Astrophysical Journal, reveals several puzzling features, said Dmitry Malyshev, a postdoctoral researcher at the Kavli Institute for Particle Astrophysics and Cosmology who co-led on the analysis.

For example, the outlines of the bubbles are quite sharp, and the bubbles themselves glow in nearly uniform gamma rays over their colossal surfaces, like two 30,000-light-year-tall incandescent bulbs screwed into the center of the galaxy.

Their size is another puzzle. The farthest reaches of the Fermi bubbles boast some of the highest energy gamma rays, but there's no discernible cause for them that far from the galaxy.

Finally, although the parts of the bubbles closest to the galactic plane shine in microwaves as well as gamma rays, about two-thirds of the way out the microwaves fade and only gamma rays are detectable.

Not only is this different from other galactic bubbles, but it makes the researchers' work that much more challenging, said Malyshev's co-lead, KIPAC postdoctoral researcher Anna Franckowiak.

"Since the Fermi bubbles have no known counterparts in other wavelengths in areas high above the galactic plane, all we have to go on for clues are the gamma rays themselves," she said.

What Made The Bubbles?
Soon after the initial discovery theorists jumped in, offering several explanations for the bubbles' origins.

For example, they could have been created by huge jets of accelerated matter blasting out from the supermassive black hole at the center of our galaxy.

Or they could have been formed by a population of giant stars, born from the plentiful gas surrounding the black hole, all exploding as supernovae at roughly the same time.

"There are several models that explain them, but none of the models is perfect," Malyshev said. "The bubbles are rather mysterious."

Creating the portrait wasn't easy.

"It's very tricky to model," said Franckowiak. "We had to remove all the foreground gamma-ray emissions from the data before we could clearly see the bubbles."

From the vantage point of most Earth-bound telescopes, all but the highest-energy gamma rays are completely screened out by our atmosphere.

It wasn't until the era of orbiting gamma-ray observatories like Fermi that scientists discovered how common extra-terrestrial gamma rays really are.

Pulsars, supermassive black holes in other galaxies and supernovae are all gamma rays point sources, like distant stars are point sources of visible light, and all those gamma rays had to be scrubbed from the Fermi data.

Hardest to remove were the galactic diffuse emissions, a gamma ray fog that fills the galaxy from cosmic rays interacting with interstellar particles.

"Subtracting all those contributions didn't subtract the bubbles," Franckowiak said. "The bubbles do exist and their properties are robust."

In other words, the bubbles don't disappear when other gamma-ray sources are pulled out of the Fermi data, in fact, they stand out quite clearly.

Franckowiak says more data is necessary before they can narrow down the origin of the bubbles any further.

"What would be very interesting would be to get a better view of them closer to the galactic center," she said, "but the galactic gamma ray emissions are so bright we'd need to get a lot better at being able to subtract them."

Fermi is continuing to gather the data Franckowiak wants, but for now, both researchers said, there are a lot of open questions.


Monday, July 28, 2014

ESA Herschel Image: Our flocculent neighbour, the spiral Triangulum Galaxy (M33)

Credit: ESA /Herschel /PACS /HerM33es Key Programme /C. Kramer /M. Boquien

The spiral galaxy M33, also known as the Triangulum Galaxy, is one of our closest cosmic neighbours, just three million light-years away.

Andromeda Galaxy (M31)
Home to some forty billion stars, it is the third largest in the Local Group of galaxies after the Andromeda Galaxy (M31) and our own Milky Way.

M33 is popular with astrophotographers and from exceptionally dark sites it can even be seen with the naked eye.

Thanks to its orientation, we can enjoy a face-on view of the beautiful spiral structure of the galaxy's disc.

This image, from ESA's Herschel space observatory, shows M33 in far-infrared light, revealing the glow of cosmic dust in the interstellar medium that permeates the galaxy.

The patchy, disorganised structure of M33's spiral arms resembles a tuft of wool, leading astronomers to classify it as a flocculent spiral galaxy.

The brightest spots sprinkled along the spiral arms are dense pockets of gas and dust where massive stars are born.

The most prominent of these is NGC604, visible in the upper left spiral arm.

This is an enormous star-forming region where hundreds of thousands of stars are taking shape.

The image is a composite of the wavelengths: 70 microns (blue), 100 microns (green) and 160 microns (red).

At the shortest wavelengths, astronomers trace warmer dust, revealing individual regions of star formation and parent clouds.

At longer wavelengths, they detect emission from colder dust, outlining some of the cool dust reservoir along the galaxy's winding spiral arms. This is where stars may be born in the future.

The image spans about one degree on each side; north is up and east is to the left. The data were collected with Herschel's PACS instrument as part of the Herschel M33 extended survey (HerM33es) Key Programme to study the star formation in the Triangulum Galaxy.

Sunday, July 27, 2014

The source of the sky's X-ray glow

In findings that help astrophysicists understand our corner of the galaxy, an international research team has shown that the soft X-ray glow blanketing the sky comes from both inside and outside the solar system.

The source of this "diffuse X-ray background" has been debated for the past 50 years.

Does it originate from the solar wind colliding with interplanetary gases within our solar system?

Or is it born further away, in the "local hot bubble" of gas that a supernova is believed to have left in our galactic neighborhood about 10 million years ago?

The scientists found evidence that both mechanisms contribute, but the bulk of the X-rays come from the bubble.

The solar wind, a stream of charged particles continuously emitted by the sun, appears to be responsible for at most 40 percent of the radiation, according to new findings published in the journal Nature.

"The overarching science goal of our work is to try to answer questions like: What does the local astrophysical environment look like? And what is the environment in which the sun was born?" said Susan Lepri, an associate professor of atmospheric, oceanic and space sciences in the University of Michigan College of Engineering.

"It's part of trying to understand our place in the universe."

Lepri, who studies the physics of the sun, provided key measurements of the solar wind and its charge states.

"This is a significant discovery," said Massimiliano Galeazzi, associate chair in the Department of Physics in the College of Arts and Sciences at the University of Miami and principal investigator of the study.

"Specifically, the existence or nonexistence of the local bubble affects our understanding of the galaxy in the proximity to the sun and can be used as foundation for future models of the galaxy structure."

The findings confirm the existence of a local hot bubble, which had been previously debated.

The research team launched a research rocket into the upper atmosphere in 2012 to analyze the diffuse X-ray background. They focused on low-energy X-rays.

"At that low energy, the light gets absorbed by the neutral gas in our galaxy, so the fact that we observe it means that the source must be 'local,' possibly within a few hundred light-years from Earth," Galeazzi said.

"Until now it was unclear whether it comes from within the solar system (within few astronomical units from Earth), or a very hot bubble of gas in the solar neighbourhood (hundreds of light-years from Earth)."

That's like trying to decide if a bright light in the sky is from an airplane or a star, Lepri said.

The next phase of the mission is scheduled to launch in December 2015. The research team also included scientists from NASA, the University of Wisconsin, the University of Kansas, Johns Hopkins University and CNES in France.

More information: The origin of the local 1/4-keV X-ray flux in both charge exchange and a hot bubble. Nature. DOI: 10.1038/nature13525

Wednesday, July 23, 2014

Astrophysicists model the formation of the oldest star in Milky Way

The illustration shows projections of the gas density, temperature and the fraction of ionized carbon in the central region where the star forms, in simulations with different abundances of the heavy elements, from 0.01 to 0.0001 times the solar value. 

The results show that a strong transition occurs for a carbon abundance of 0.01 times the solar value, providing a pathway for the formation of low-mass stars. 

Credit: Institute for Astrophysics Göttingen

A team of researchers led by Dr. Stefano Bovino at the Institute for Astrophysics Göttingen (IAG) has conducted high-resolution simulations investigating the formation of the oldest-known star in our galaxy, SMSS J031300.36-670839.3, on a Cray supercomputer of the North-German Supercomputing Alliance.

Using the star's abundance patterns, the scientists have performed cosmological simulations which include the dynamics of gas and dark matter as well as the chemical evolution.

From this simulation, the scientists expect to obtain an improved understanding of the transition from the first to the second generation of stars in the universe.

The results of their study were published in the Astrophysical Journal Letters.

The stars of the first generation have formed out of a primordial gas consisting only of hydrogen and helium.

Their mass was ranging from ten to five hundred times the mass of our Sun.

Nuclear processes in the interior of these stars have created heavy elements like iron, silicon, carbon and oxygen.

When these stars died during the first supernova explosions, the heavy elements have been ejected, and stars of the second generation could form.

"Even for the oldest-known star in the Milky Way galaxy, our simulations indicate that the gas efficiently cools due to the presence of heavy elements," says Dr. Bovino. Such conditions favour the formation of low-mass stars.

The results therefore strongly suggest that the transition to the second generation already occurred after the first supernova explosion.

"The heavy elements provide additional mechanisms for the gas to cool, and it is very important to follow their chemical evolution," explains Dr. Tommaso Grassi from the Center for Star and Planet Formation at the University of Copenhagen.

The scientists have considered SMSS J031300.36-670839.3 for their study, as its abundance patterns were previously shown to be consistent with one single low-energy supernova.

"It seems very likely that this star is indeed one of the very first stars forming out of the metal-enriched gas, providing the chemical conditions right after the first supernova explosion," says Prof. Dominik Schleicher at the IAG.

While this star has a tiny amount of heavy elements, it has a relatively higher carbon abundance.

It in fact represents an entire class with similar properties, and the scientists expect a very similar formation pathway for the entire class.

"The mass of the stars mostly depends on the temperature of the gas, as gravity needs to overcome the thermal pressure during star formation," says Dr. Muhammad Latif, a scientist in the Göttingen Collaborative Research Center 963 on Astrophysical Flow Instabilities and Turbulence.


The new simulations became feasible through the development of the chemistry package KROME, an effort led by Dr. Grassi in Copenhagen.

In the future, the scientists plan to explore a wide range of possible conditions to understand the formation of the most metal-poor stars observed in our Milky Way galaxy.

More information: "Formation of carbon-enhanced metal-poor stars in the presence of far ultraviolet radiation," Stefano Bovino et al., 2014, Astrophysical Journal Letters, Volume 790, L35: dx.doi.org/10.1088/2041-8205/790/2/L35 , On Arxiv: arxiv.org/abs/1406.4450

Tuesday, July 22, 2014

Massive neutrinos and new standard cosmological model

The research group demonstrates that adding such massive neutrinos to the standard model does not really explain all datasets. 

Credit: The Milky Way, NASA. 

Neutrinos, also known as 'ghost particles' because they barely interact with other particles or their surroundings, are massless particles according to the standard model of particle physics.

However, there is a lot of evidence that their mass is in fact non-zero, but it remains unmeasured. In cosmology, neutrinos are suspected to make up a fraction, small but important, of the mysterious dark matter, which represents 90% of the mass of the galaxy.

Modifying the standard cosmological model in order to include fairly massive neutrinos does not explain all the physical observations simultaneously.

Licia Verde, ICREA
This is the conclusion of a new scientific paper published in the journal Physical Review Letters, signed by Licia Verde, ICREA researcher from the Institute of Cosmos Sciences of the University of Barcelona (ICCUB), Boris Leistedt and Hiranya V. Peiris, from the University College London.

A model that does not meet observed data
Some scientific studies suggest that the existence of massive neutrinos could potentially explain other physical anomalies and phenomena observed in the Universe (for instance, the number of galaxy clusters observed by the Planck satellite).

This hypothesis represents an extension of the standard cosmological model and may have profound implications for both cosmology and particle physics.

In the article published in the journal Physical Review Letters, the research group demonstrates that adding such massive neutrinos to the standard model does not really explain all datasets.

Researcher Licia Verde affirms that "the new paper proves that the new model is in fact not a satisfying solution, in the sense that it is not able to explain all data sets simultaneously. Therefore, it cannot be the correct model of the Universe".

Neutrinos: elusive and difficult to detect particles
Neutrinos travel almost at the speed of light. Most of thousands of millions of neutrinos passing through the Earth emanate from the Sun and the atmosphere.

However, gamma ray explosions, star formation and other cosmic phenomena can produce these particles, which are extremely hard to detect.

Huge laboratories, such as the IceCube in Antartica, are necessary, and they only capture a few neutrinos (leading to poor measurements of neutrinos masses).

Therefore, measuring the exact masses of the neutrinos is a major milestone for the entire physics community.

"Neutrinos' properties can be also measured by studying the cosmos, explains researcher Licia Verde, but cosmological observations have not detected neutrinos' mass yet".

According to Licia Verde, "we know that the mass of neutrinos is between ~0.05 eV and ~0.2 eV, so cosmology is closing in.

There is a lot of work to do in order to get a robust measure but we hope that the next generation of cosmological data will be able to 'see' the mass of neutrinos and provide a more accurate measure of the mass of these particles".

Licia Verde, ICCUB researcher, also participates in the international project Sloan Digital Sky Survey (SDSS-III), one of the largest galaxy survey.

She was member of the Wilkinson Microwave Anisotropy Probe (WMAP) team, and was awarded with the 2012 Gruber Cosmology Prize for her pioneering contributions to the study of primitive Universe.

More information: "No New Cosmological Concordance with Massive Sterile Neutrinos." Boris Leistedt, Hiranya V. Peiris, Licia Verde. Physical Review Letters. dx.doi.org /10.1103 /PhysRevLett.113.041301