Showing posts with label USGS. Show all posts

Wednesday, December 17, 2014

MARS HiRise Map: Signs of Ancient Mars Lakes and Quakes

Long ago, in the largest canyon system in our solar system, vibrations from "marsquakes" shook soft sediments that had accumulated in Martian lakes.

The shaken sediments formed features that now appear as a series of low hills apparent in a geological map based on NASA images.

The map was released by the U.S. Geological Survey (USGS).

This map of the western Candor Chasma canyon within Mars' Valles Marineris is the highest-resolution Martian geological map ever relased by USGS.

It is derived from images taken by the High Resolution Imaging Science Experiment (HiRISE) camera on NASA's Mars Reconnaissance Orbiter (MRO), which reveal details smaller than a desk.

"This new map shows that at the time these sediments were deposited, a part of west Candor Chasma, specifically Condor Colles, contained numerous shallow, spring-fed lakes," said map author Chris Okubo of the USGS Astrogeology Science Center, Flagstaff, Arizona.


"These lakes helped to trap wind-blown sand and dust, which accumulated over time and formed the extensive sedimentary deposits we see today."

The wet sediments experienced seismic shaking in "marsquakes" related to movement along several large geological faults in the area. A series of low hills resulted.

Valles Marineris is more than 2,500 miles (4,000 kilometers) long. The conditions under which sedimentary deposits in it formed have been an open issue for decades.

Possibilities proposed have included accumulation in lakebeds, volcanic eruptions under glaciers within the canyons, and acculation of wind-blown sand and dust.

The map is available for download here. Additional information about the map is available here.

Tuesday, July 8, 2014

USGS: New Red Planet Map Shows Water Shaped Mars' Highlands

A small portion of the 118-megabyte new map of Mars' southern highlands published by the United States Geological Survey (USGS).

Credit: Scott Mest and David Crown/USGS

A very detailed new map of Mars' southern highlands shows how profoundly liquid water sculpted the region long ago, scientists say.

David Crown
"This new map depicts the complicated sequence of geologic processes that have served to modify ancient, rugged highland terrains surrounding the Hellas impact basin and shows evidence for the persistent effects of water and ice in degrading the Martian surface," David Crown, of the Planetary Science Institute (PSI) in Tucson, Arizona, said in a statement.

Crown and his PSI colleague Scott Mest produced the new map, which was published by the United States Geological Survey (USGS).

It covers the area on Mars from 27.5 to 42.5 degrees south latitude and 110 to 115 degrees east longitude.

Figure showing the area covered (crosshatched) by the USGS's new map of Mars' southern highlands.

Credit: Scott Mest and David Crown/USGS

The map sheds particular light on the evolution of two canyon systems in the southern highlands, Waikato Vallis and Reull Vallis.

Researchers think both canyons formed when underground water came to the surface, collapsing the ground.

Images from NASA's two Viking orbiters, which began circling the Red Planet in the 1970s, seemed to suggest that Waikato Vallis and Reull Vallis were part of the same ancient canyon system.

But the new map, constructed with data collected by NASA's Mars Reconnaissance Orbiter (MRO), Mars Odyssey and Mars Global Surveyor spacecraft, reveals that Waikato and Reull were actually separate canyons separated by a plains landscape known as Eridania Planitia.

In fact, water released from Waikato Vallis formed a shallow lake in these plains long ago, scientists said.

While Waikato and Reull are the dominant landforms in the area, the new map also shows many small channels that flowing water carved into the southern highlands, likely about the same time the two big canoyns were forming, researchers said.

"Most highland peaks and the walls of many impact craters show evidence that ice-rich sediments flowed downhill, forming features that resemble rock glaciers on Earth; these features represent the most recent water-related activity in the area, and may be active today," PSI representatives wrote in a description of the new map.

You can download a free copy of the 118-megabyte Mars map from the USGS website.

Friday, March 21, 2014

NASA Landsat-8: Tracking urban change and flood risk

This is an artist's rendition of the Landsat 8 satellite

Credit: NASA /USGS

When it comes to helping communities across the United States stay up-to-date on their flood risk, the Landsat satellite can take a bow.

Landsat 8 satellite images help track urban change, a factor that can impact a community's flood risk.

The Federal Emergency Management Agency (FEMA), uses these images to help identify where they should launch a new flood study.

Flood studies determine how prone different neighborhoods are to floods of a certain intensity or likelihood.

Successful flood studies require an arsenal of tools, however, including data on river flows and storm tides, hydrological and hydraulic analysis of landscape and river systems, and historic rain data, to name a few.

These studies have adding satellite data from Landsat 8 satellite to the toolkit. With its archive of images capturing sprawling cities and new developments, Landsat helps FEMA track how building and construction is impacting an area's landscape.

Earth-observing Landsat 8 satellites have been capturing images of the planet's surface since 1972.

Landsat 8, the newest satellite in the joint NASA and U.S. Geological Survey (USGS) program, was launched Feb. 11, 2013, and now collects more than 400 images per day.

New and archived Landsat data are available free to the public from USGS. Researchers put the free data to a multitude of uses.

"If you identify areas where urban change is accelerating, there are consequences," said Zack Roehr, a senior spatial analyst with Dewberry, Fairfax, Va., a FEMA subcontractor.

Urbanization can spell trouble for flood risk. Soil typically acts like a sponge, absorbing water from rainfall.

When soil is covered with concrete or other impermeable material, water has nowhere to flow except towards storms and rivers, thereby increasing flood risk.

"The ground is no longer able to hold water, which means local flooding sources are going to receive more of that water," Roehr said. "The flooding characteristics are going to change."

Tuesday, March 4, 2014

USGS basemap of Jupiter's moon Europa

This reprojection of the official USGS basemap of Jupiter's moon Europa is centered at the estimated source region for potential water vapor plumes that might have been detected using the Hubble Space Telescope

The view is centered at -65 degrees latitude, 183 degrees longitude.

In addition to the plume source region, the image also shows the hemisphere of Europa that might be affected by plume deposits. 

This map is composed of images from NASA's Galileo and Voyager missions. 

The black region near the south pole results from gaps in imaging coverage.

Image Credit: NASA /JPL-Caltech /SETI Institute

Thursday, February 13, 2014

Global map of Ganymede, Jupiter's biggest moon

Making the map of Ganymede was a long and complex task. 

Some of the scientists behind the map were graduate students and postdocs at Brown University when the Galileo data began to arrive in the 1990s. 

Image courtesy U.S. Geological Survey.

Scientists, including Brown University geologists and students, have completed the first global geological map of Ganymede, Jupiter's largest moon and the largest in the solar system.

With its varied terrain and possible underground ocean, Ganymede is considered a prime target in the search for habitable environments in the solar system, and the researchers hope this new map will aid in future exploration.

Geoffrey Collins
The work, led by Geoffrey Collins, a Ph.D. graduate of Brown now a professor at Wheaton College in Massachusetts, took years to complete.

"It is very rewarding to see the results of all of our efforts here at Brown come together into this integrated global compilation that will now be used to plan the next phase of scientific exploration of the Galilean satellites," said Jim Head, the Scherck Distinguished Professor of Geological Sciences at Brown and one of the map's co-authors.


The researchers combined images from the Voyager and Galileo spacecraft to put the map together. Voyager was the first mission to fly through the Jupiter satellite system and passed by the icy surface of Ganymede in 1979.

Those first images revealed a complex surface, segmented and fractured into dark and light terrain.

In 1995, the Galileo spacecraft was placed in orbit around Jupiter and began to return high-resolution images of the surface that help to understand many of the features seen at low-resolution by Voyager.

Jim Head
Head was a co-investigator on the Galileo's Solid State Imaging (SSI) experiment.

In that role, he and his team were responsible for planning the imaging sequences for Ganymede in order to identify and investigate the scientific targets of highest priority.

The team worked for several years to obtain the data necessary to make the global map.

"This was an amazing time," Head said. "Brown graduate and undergraduate students worked shoulder-to-shoulder in the Planetary Geosciences Laboratory in Lincoln Field Building, studying the newly acquired images and choosing new sites of scientific interest."

"The discoveries were daily and the adrenaline was surging as we rushed to collect our thoughts and plans, review them with the SSI Team, and get them uploaded to the spacecraft in time for the next encounter."

"I'm so glad all that work has paid off in the form of this detailed global map," Head said.

"It is equally rewarding to see that the Brown team has now moved on to positions of leadership in the planetary exploration research community."

The new geological map of Ganymede, published yesterday by the U.S. Geological Survey

Thursday, January 2, 2014

NASA Earth Observatory image: Sagarmatha: “mother of the universe”

Image Credit: NASA Earth Observatory image by Jesse Allen and Robert Simmon, using EO-1 ALI data from the NASA EO-1 team, archived on the USGS Earth Explorer.

Fourteen mountain peaks on Earth stand taller than 8,000 meters (26,247 feet).

The tallest of these “eight-thousanders” is Mount Everest, the standard to which all other mountains are compared.

The Nepalese name for the mountain is Sagarmatha: “mother of the universe.”

Everest’s geological story began 40 million years ago when the Indian subcontinent began a slow-motion collision with Asia.

John McPhee
The edges of two continents jammed together and pushed up the massive ridges that make up the Himalayas today.

Pulitzer-winning journalist John McPhee summed up the wonder of the mountain’s history when he wrote Annals of the Former World:
"The summit of Mount Everest is marine limestone. This one fact is a treatise in itself on the movements of the surface of the Earth. If by some fiat, I had to restrict all this writing to one sentence; this is the one I would choose."
In other words, when climbers reach the top of Mount Everest, they are not standing on hard igneous rock produced by volcanoes.

Rather, they are perched on softer sedimentary rock formed by the skeletons of creatures that lived in a warm ocean off the northern coast of India tens of millions of years ago.

Meanwhile, glaciers have chiseled Mount Everest’s summit into a huge, triangular pyramid, defined by three faces and three ridges that extend to the northeast, southeast, and northwest.

Edmund Hillary
The southeastern ridge is the most widely used climbing route. It is the one that Edmund Hillary and Tenzing Norgay followed in May 1953 when they became the first climbers to reach the summit and return safely.

Despite its reputation as an extremely dangerous mountain, commercial guiding has done much to tame Everest in the last few decades.

As of March 2012, there had been 5,656 successful ascents of Everest, while 223 people had died—a fatality rate of 4 percent.

Monday, July 15, 2013

Volcano Redoubt: Volcanoes 'scream' at ever-higher pitches until they erupt

Redoubt Volcano on March 31, 2009. View to the east of the summit crater of the volcano, heavily covered with deposits from recent eruptions, many of which were preceded by harmonic tremor.

Credit: Game McGimsey

It is not unusual for swarms of small earthquakes to precede a volcanic eruption.

They can reach a point of such rapid succession that they create a signal called harmonic tremor that resembles sound made by various types of musical instruments, though at frequencies much lower than humans can hear.

A new analysis of an eruption sequence at Alaska's Redoubt Volcano in March 2009 shows that the harmonic tremor glided to substantially higher frequencies and then stopped abruptly just before six of the eruptions, five of them coming in succession.

Alicia Hotovec-Ellis
"The frequency of this tremor is unusually high for a volcano, and it's not easily explained by many of the accepted theories," said Alicia Hotovec-Ellis, a University of Washington doctoral student in Earth and space sciences.

Documenting the activity gives clues to a volcano's pressurization right before an explosion.

That could help refine models and allow scientists to better understand what happens during eruptive cycles in volcanoes like Redoubt, she said.

The source of the earthquakes and harmonic tremor isn't known precisely. Some volcanoes emit sound when magma – a mixture of molten rock, suspended solids and gas bubbles – resonates as it pushes up through thin cracks in the Earth's crust.

But Hotovec-Ellis believes in this case the earthquakes and harmonic tremor happen as magma is forced through a narrow conduit under great pressure into the heart of the mountain.

The thick magma sticks to the rock surface inside the conduit until the pressure is enough to move it higher, where it sticks until the pressure moves it again.

Each of these sudden movements results in a small earthquake, ranging in magnitude from about 0.5 to 1.5, she said. As the pressure builds, the quakes get smaller and happen in such rapid succession that they blend into a continuous harmonic tremor.

"Because there's less time between each earthquake, there's not enough time to build up enough pressure for a bigger one," Hotovec-Ellis said. "After the frequency glides up to a ridiculously high frequency, it pauses and then it explodes."

She is the lead author of a forthcoming paper in the Journal of Volcanology and Geothermal Research that describes the research. Co-authors are John Vidale of the UW and Stephanie Prejean and Joan Gomberg of the U.S. Geological Survey.

The pause in the harmonic tremor frequency increase just before the volcanic explosion is the main focus of the Nature Geoscience paper.

"We think the pause is when even the earthquakes can't keep up anymore and the two sides of the fault slide smoothly against each other," Hotovec-Ellis said.

Upward-gliding tremor immediately before a volcanic explosion also has been documented at the Arenal Volcano in Costa Rica and Soufrière Hills volcano on the Caribbean island of Montserrat.

"Redoubt is unique in that it is much clearer that that is what's going on," Hotovec-Ellis said. "I think the next step is understanding why the stresses are so high."

More information: Paper: DOI: 10.1038/ngeo1879

Wednesday, May 8, 2013

USGS LandSat-8: LDCM Earth Observation satellite appears to be working flawlessly

A new satellite hovering nearly 450 miles (725 kilometers) above the Earth appears to working flawlessly as it embarks on a 10-year mission to document the planet's surface, scientists and engineers at the U.S. Geological Survey's Earth Resources Observation and Science Center said Monday.

LDCM Landsat 8 is sending more than 400 data-filled images per day back to the EROS center north of Sioux Falls, where they will be archived and made available for free download by scientists or anyone else who's interested.

Tom Loveland
The center's mission requires images to be publicly available within 48 hours of their capture, though most will be ready within 24 hours, said project scientist Tom Loveland.

The new orbiter has several advantages over its still-functioning predecessor Landsat 7, which captures just 250 images a day.

Landsat 8 also boasts two new spectral bands, one to see deeper into oceans, lakes and rivers and another to detect cirrus clouds and correct for atmospheric effects, Loveland said.

The new satellite's infrared band is split into two, allowing for more accurate surface temperature readings, he added.

"It should really make a difference in our ability to map and characterize changes going on in the surface of the Earth," Loveland said.

NASA launched Landsat 8 into space in February. Since then, teams have been running it through a barrage of tests before placing the satellite into orbit 438 miles (705 kilometers) above the planet's surface.

Jim Nelson
"The spacecraft has been extremely healthy," said Jim Nelson, ground systems manager. "The instruments have performed really well."

The EROS Center, the main federal repository for satellite images, will officially take over the mission May 30 from NASA.

Since 1972, Landsat satellites have been continuously snapping pictures across the globe as part of a 40-year mission to document the planet.

Landsat 8, which is about the size of parcel delivery truck with a 30-foot (9-meter)-long deployed sheet of solar panels, is stocked with a 10-year supply of fuel. It travels at a speed of 17,000 miles (27,360 kilometers) per hour.

Landsat 8 will work in tandem with Landsat 7, launched in 1999, to take pictures of each inch of the planet's surface every eight days. Landsat 7 continues to operate despite a faulty scan line corrector that leaves zigzag gaps in some images.

Landsat 5, which dates back to 1984, worked decades past its expected mission end but began failing in November. Landsat 6 never reached orbit after its 1993 launch because of a ruptured manifold.

Nelson said the EROS Center has been preparing for the wave of new data, upgrading its ground station near Sioux Falls as well as partner facilities in Alaska and Norway.

It also overhauled its data processing and storage systems, "so we can get as much data as possible online for the users to get direct access to," Nelson said.

Loveland said there's a huge demand for the images in the scientific community, giving an example of a recent Brazilian Remote Sensing Symposium that drew more than 800 people looking to tap into the data.

The center used to charge for the images, but for years now, they've been free.

"When you put all this free stuff in universities, innovation happens," Loveland said."

Monday, May 6, 2013

NASA USGS Landsat thermal sensor lights up from volcano's heat

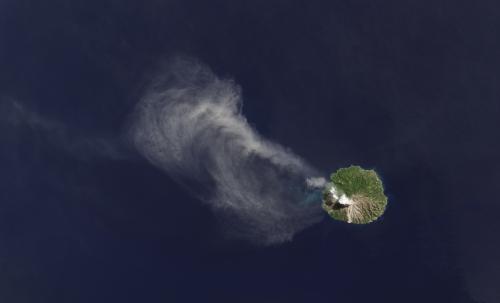
An ash plume drifts from Paluweh volcano in Indonesia in this image, taken April 29, 2013, from the Landsat Data Continuity Mission's Operational Land Imager instrument

Credit: Robert Simmon, NASA's Earth Observatory, using data from USGS and NASA

As the Landsat Data Continuity Mission satellite flew over Indonesia's Flores Sea April 29, it captured an image of Paluweh volcano spewing ash into the air.

The satellite's Operational Land Imager detected the white cloud of smoke and ash drifting northwest, over the green forests of the island and the blue waters of the tropical sea.

The Thermal Infrared Sensor (TIRS) on LDCM picked up even more.

By imaging the heat emanating from the 5-mile-wide volcanic island, TIRS revealed a hot spot at the top of the volcano where lava has been oozing in recent months.

The two LDCM instruments, working together, illustrate a quote from Aristotle: The whole is greater than the sum of its parts, said Betsy Forsbacka, TIRS instrument manager at NASA's Goddard Space Flight Center in Greenbelt, Md.

"Each instrument by itself is magnificent," she said. "When you put them together, with the clues that each give you on what you're seeing on Earth's surface, it's greater than either could do by themselves."

The image of Paluweh also illuminates TIRS' abilities to capture the boundaries between the hot volcanic activity and the cooler volcanic ash without the signal from the hot spot bleeding over into pixels imaging the cooler surrounding areas.

TIRS engineers tested and refined the instrument pre-launch to ensure each pixel correctly represents the heat source it images on Earth's surface.

Otherwise, Forsbacka said, it would be like shining a flashlight in your eyes—the bright light can leave you seeing spots and halos where it should be dark.

The same effect can occur with detectors. But the contrast is sharp on the Paluweh image.

A bright white hot spot, surrounded by cooler dark ash clouds, shows the volcanic activity at Paluweh volcano in the Flores Sea, Indonesia. 

This thermal image was taken by the Landsat Data Continuity Mission's Thermal Infrared Sensor on April 29, 2013. 

Credit: Robert Simmon, NASA's Earth Observatory, using data from USGS and NASA

"We can image the white, representing the very hot lava, and right next to it we image the gray and black from the cooler surrounding ash," Forsbacka said.

"It's exciting that we're imaging such diverse thermal activity so well. The TIRS instrument can also pick up subtle shifts of temperatures, within a 10th of a degree Celsius and, with two different thermal bands instead of the one band on previous Landsat satellites, LDCM is poised to make it easier for scientists to subtract out the effects of the atmosphere on the signal, obtaining a more accurate temperature of Earth's surface."

Friday, March 22, 2013

NASA, USGS release first Landsat 8 images

The area around Boulder, Colo., is shown here in a true colour image collected by the OLI aboard LDCM on March 18, 2013. 

The OLI and an important component of TIRS, its cryocooler, were built at the Ball Aerospace & Technologies Corporation facility in Boulder. 

Credit: USGS/NASA Earth Observatory

NASA and the Department of the Interior's U.S. Geological Survey (USGS) have released the first images from the Landsat Data Continuity Mission (LDCM) satellite, which was launched Feb. 11.

The natural-colour images show the intersection of the United States Great Plains and the Front Range of the Rocky Mountains in Wyoming and Colorado.

In the images, green coniferous forests in the mountains stretch down to the brown plains with Denver and other cities strung south to north.

"We are very excited about this first collection of simultaneous imagery," said Jim Irons, LDCM project scientist at NASA's Goddard Space Flight Center in Greenbelt, Md.

"These images confirm we have two healthy, functioning sensors that survived the rigors of launch and insertion into Earth orbit."

Since launch, LDCM has been going through on-orbit testing.

The mission operations team has completed its review of all major spacecraft and instrument subsystems, and performed multiple spacecraft attitude maneuvers to verify the ability to accurately point the instruments.

The two LDCM sensors collect data simultaneously over the same ground path. OLI collects light reflected off the surface of Earth in nine different regions of the electromagnetic spectrum, including bands of visible light and near-infrared and short-wave-infrared bands, which are beyond human vision.

TIRS collects data at two longer wavelength thermal infrared bands that measure heat emitted from the surface.

By looking at different band combinations, scientists can distinguish features on the land surface.

These features include forests and how they respond to natural and human-caused disturbances, and the health of agricultural crops and how much water they use.

Data from LDCM will extend a continuous, 40-year-long data record of Earth's surface from previous Landsat satellites, an unmatched, impartial perspective that allows scientists to study how landscapes all across the world change through time.

The natural-colour images were processed by the EROS Data Center north of Sioux Falls.

"These first scenes from the new Landsat satellite continue the remarkable output from the Landsat program with better, more useful imagery and information," said Matthew C. Larsen, associate director for climate and land use change at the U.S. Geological Survey in Reston, Va.

"We are gratified that this productive partnership between USGS and NASA has maintained the continuity and utility of this essential satellite tool, providing the foundation for land and water management around the globe."

As planned, LDCM currently is flying in an orbit slightly lower than its operational orbit of 438 miles (705 kilometers) above Earth's surface.

As the spacecraft's thrusters raise its orbit, the NASA-USGS team will take the opportunity to collect imagery while LDCM is flying under Landsat 7, also operating in orbit.

Measurements collected simultaneously from both satellites will allow the team to cross-calibrate the LDCM sensors with Landsat 7's Enhanced Thematic Mapper-Plus instrument.

"So far, our checkout activities have gone extremely well," said Ken Schwer, LDCM project manager at Goddard.

"The mission operations team has done a tremendous job getting us to the point of imaging Earth." During the next few weeks, this team will calibrate the instruments and verify they meet performance specifications.

After its checkout and commissioning phase is complete, LDCM will begin its normal operations in May. At that time, NASA will hand over control of the satellite to the USGS, which will operate it throughout its planned five-year mission life.

The satellite will be renamed Landsat 8. USGS will process data from OLI and TIRS and add it to the Landsat Data Archive at the USGS Earth Resources Observation and Science Center, where it will be distributed for free via the Internet.

For more information on these first LDCM images

For more information on the LDCM mission.

Sunday, September 2, 2012

Kilauea: Tiny Gravity Changes Show Magma's Underground Movements

Kilauea's current eruption is still going strong after 29 years.

CREDIT: USGS/HVO.

The secret movements of magma deep inside a volcano can be detected by tracking the subtle changes in gravity they cause.

Surprising readings from a Hawaiian volcano have researchers hoping to better understand volcanic activity through gravity monitoring.

Continuous gravity measurements of active volcanoes are relatively rare, with most results coming from Mount Etna in Italy.

"One problem is the expense," researcher Michael Poland, a geophysicist at the U.S. Geological Survey's Hawaiian Volcano Observatory, explained.

"Gravity measurements have always been a really expensive endeavor. The big users are oil and mining companies."

Now scientists have monitored the gravity at Kīlauea, a popular tourist destination on Hawaii's Big Island, and discovered a regular cycle of fluctuations that suggest magma is churning a kilometer (0.6 miles) below the surface.

The way magma churns in underground chambers below volcanic vents is key to understanding how persistent volcanoes are, and whether or not they might catastrophically erupt in the future.

However, what goes on deep under the Earth's surface is difficult to monitor.

One way to peer underground is by looking at Earth's gravity, the researchers said. Anything that has mass has a gravity field that pulls objects toward it.

The strength of this field depends on the amount of mass. Since the Earth's mass is not spread out evenly, this means the strength of the planet's gravitational pull is stronger in some places and weaker in others.

As such, the flow of magma from one place to another can be detected from above.

Most active volcano

"Kīlauea is the world's most active volcano," Poland said. "It's erupted almost continuously since 1983. It's a natural 'lab volcano' ―a great place to try and study something like gravity measurements."

The researchers installed two continuous gravity meters at the summit of the volcano in 2010. One was about 1.2 miles (2 kilometers) northwest of the eruptive vent at the summit and recorded measurements every10 seconds, while the other was placed about 500 feet (150 meters) east and recorded data every second.

They detected gravity fluctuations that came in a cycle about 150 seconds long.

"There was no expectation for that kind of result," Poland reported. "That gravity oscillation came out of nowhere. It points to the idea that there's probably a lot of things going on in volcanoes, glaciers, wherever you look, but we haven't developed the tools to detect these sorts of things."